
AEO 2025 Trends: Enhanced Decarbonization Opportunities
Introduction
As part of OnLocation’s weekly “AEO 2025 Trends” series, this blog examines the U.S. Energy Information Administration’s (EIA) Annual Energy Outlook (AEO) 2025 projections with a focus on model enhancements that improve the representation of hydrogen markets, carbon capture technologies, and the industrial sector. The AEO provides an important benchmark of U.S. energy system projections to various government agencies, research institutions, and industry leaders. These projections rely on the National Energy Modeling System (NEMS), a U.S. energy-economic model that is an industry standard with detailed data and representation of energy markets, policies, and technologies in all energy supply and demand sectors.
As part of EIA’s multi-year effort to enhance NEMS, several new modules were added, others were significantly modified, and their results included in the AEO 2025 scenarios. In our previous blog post “AEO 2025 Trends: Oil and Gas Supply” we discussed the Hydrocarbon Supply Module (HSM), the replacement for the Oil and Gas Supply Module (OGSM). In this article we examine two new modules for AEO 2025, the Hydrogen Market Module (HMM) and the Carbon Capture, Allocation, Transportation, and Sequestration (CCATS) Module. Additionally, we review EIA’s updates to the industrial model which further their goal of better representing decarbonization efforts in demand sectors. This article focuses on the key results from the AEO 2025 scenarios from these three modules.
Hydrogen Market Module (HMM)
OnLocation has previously developed an HMM to the AEO2023 model as part of its customized version of NEMS (OL-NEMS) model suite and included several hydrogen production technologies that used a variety of fuels such as natural gas, coal, biomass, and electricity. This HMM projected new hydrogen supply and prices based on demand from mainly transportation (freight trucks) and industry (steel, refining, and ammonia). We included the impact of our HMM in our post “U.S. Energy Horizons to 2050: A Special Report.” EIA’s new HMM in AEO 2025 also models the conversion of fuels to hydrogen but is based on three primary production technologies:
- Natural gas steam methane reforming (SMR) without carbon capture: This is the most prevalent method for hydrogen production in use today.
- Natural gas steam methane reforming (SMR) with carbon capture: This is the same as the SMR technology but with additional carbon capture of the natural gas fuel emissions, incentivized by the Inflation Reduction Act (IRA) expanded Section 45Q tax credits for CO2 sequestration.
- Proton Exchange Membrane (PEM) Electrolysis: This technology converts electricity into hydrogen and is favored for its fast start-up times, making it suitable for integration with renewable energy sources and producing low emissions. It is also incentivized by the IRA Section 45V tax credit for clean hydrogen production.
Additionally, the EIA HMM not only considers hydrogen demand from new sources such as steel and vehicles but also aggregates existing hydrogen production that previously was not explicitly modeled as output from SMRs but only indirectly through increased natural gas consumption across the refining and bulk chemical industry. As a result, its projections include all hydrogen consumption, and the previously implicit natural gas consumption used in hydrogen production is no longer reported as part of demand sector consumption. Existing hydrogen demand met through byproduct hydrogen from industrial processes, about 24 percent of the total, is now also reported separately. Like OL-NEMS, the HMM in AEO 2025 calculates wholesale hydrogen prices and applies sector-specific markups to account for logistics and delivery costs, with a high markup for the transportation sector relative to other uses of hydrogen to account for the higher cost of distributing hydrogen to refueling stations.
The AEO 2025 has a detailed representation of the Section 45V production tax credit requirements. To get this credit, hydrogen from electrolyzers can consume curtailed electricity from renewable sources or purchase Energy Attribute Certificates (EACs) if they meet the criteria for deliverability (generation and production in the same region), incrementality (generator start date within 3 years of production start date), and hourly time matching (generation and production in the same hour).
Key Results on Hydrogen
Figure 1 shows the demand for hydrogen in the AEO 2025 Reference and Alt Transport cases. Hydrogen demand is directly related to the industrial shipments in chemicals and refining so it does not vary across the two scenarios. The transportation sector sees significant demand growth after 2030 in the Reference case, with increased use for freight trucks. But in the Alt Transportation case that assumes several recent regulations requiring low emitting vehicles are no longer in place, this demand disappears. Although use of hydrogen turbines in the power sector is available, the power sector builds a very small capacity for new turbines in the Alt Transport case and none in the Reference case in favor of cheaper alternative technologies.
Figure 2 shows the impact of demand on the production of hydrogen by technology in the same two cases. While byproduct hydrogen is a constant input, hydrogen from SMRs dominates production in both cases, although it is lower in the Alt Transportation case due to reduced demand in the transportation sector. The reduced demand also leads to less production from SMRs with Carbon Capture and Sequestration (CCS) in the Alt Transportation case, whereas it grows in the Reference case in the middle years before declining once the 45Q credit expires. Hydrogen from electrolyzers is insignificant in the Reference case and nonexistent in the Alt Transportation case despite the availability of 45V credits.
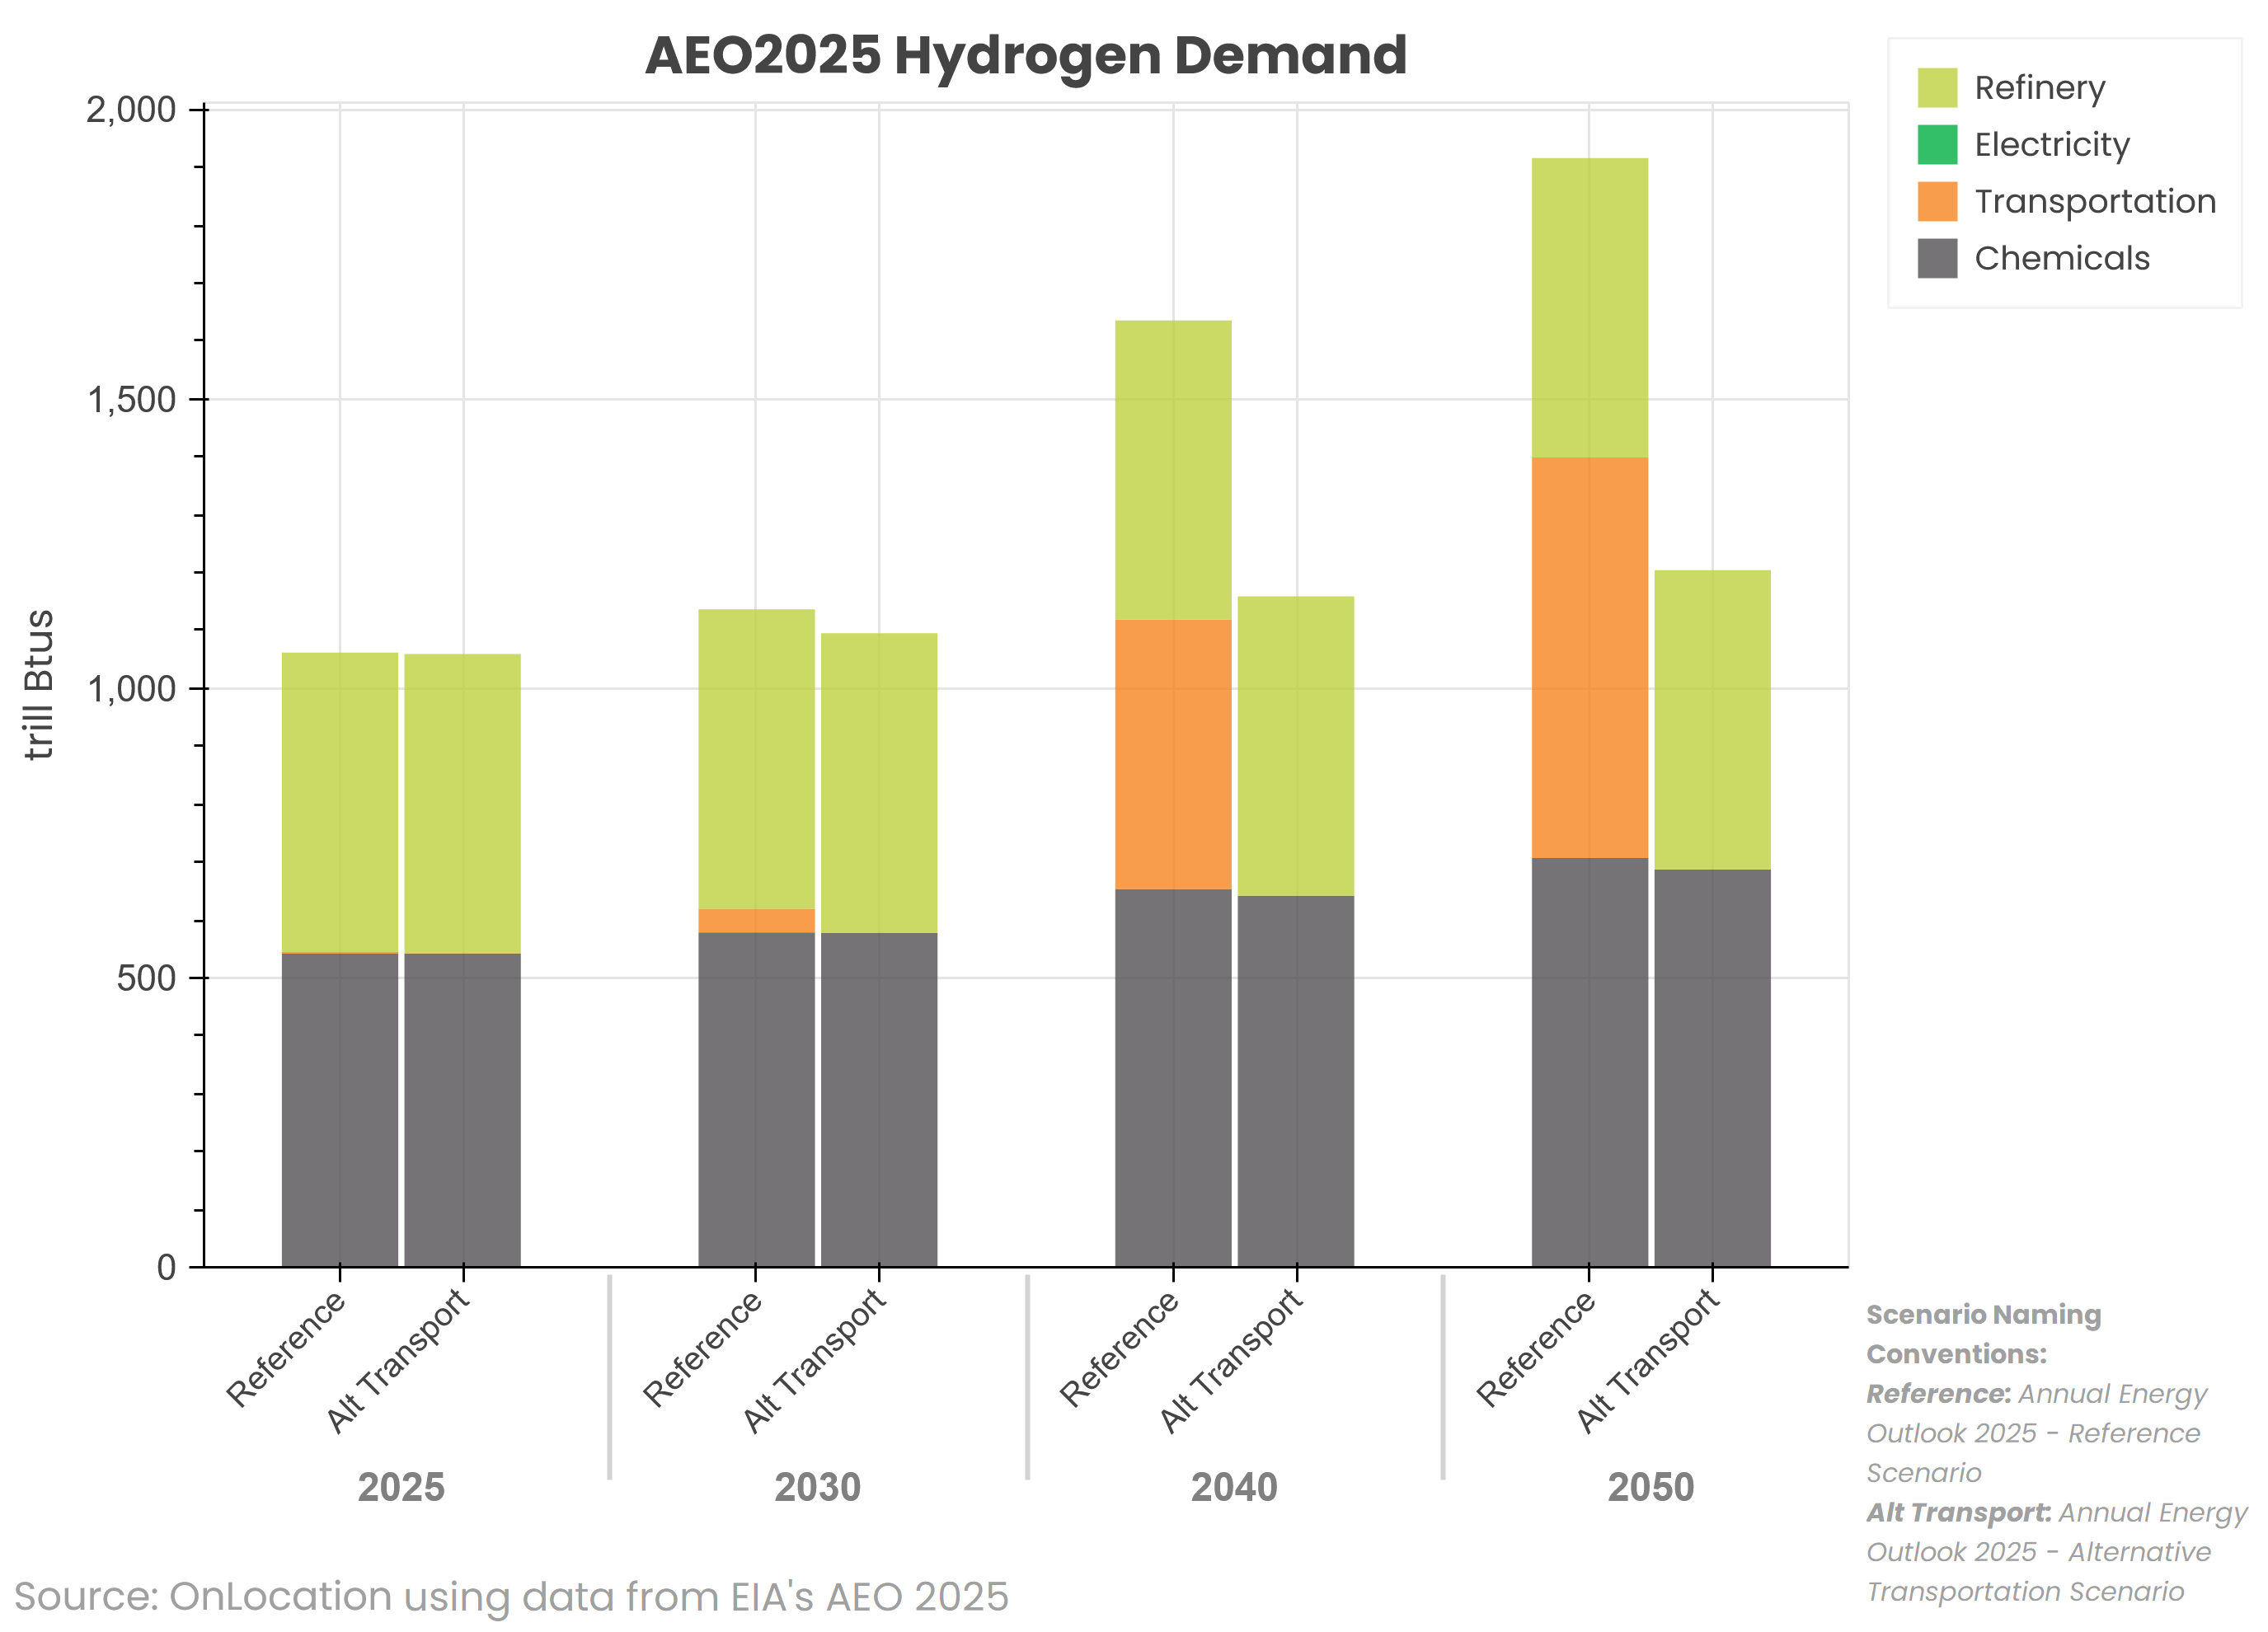
Figure 1: AEO 2025 Hydrogen Demand by Sector (Reference and Alt Transport cases)
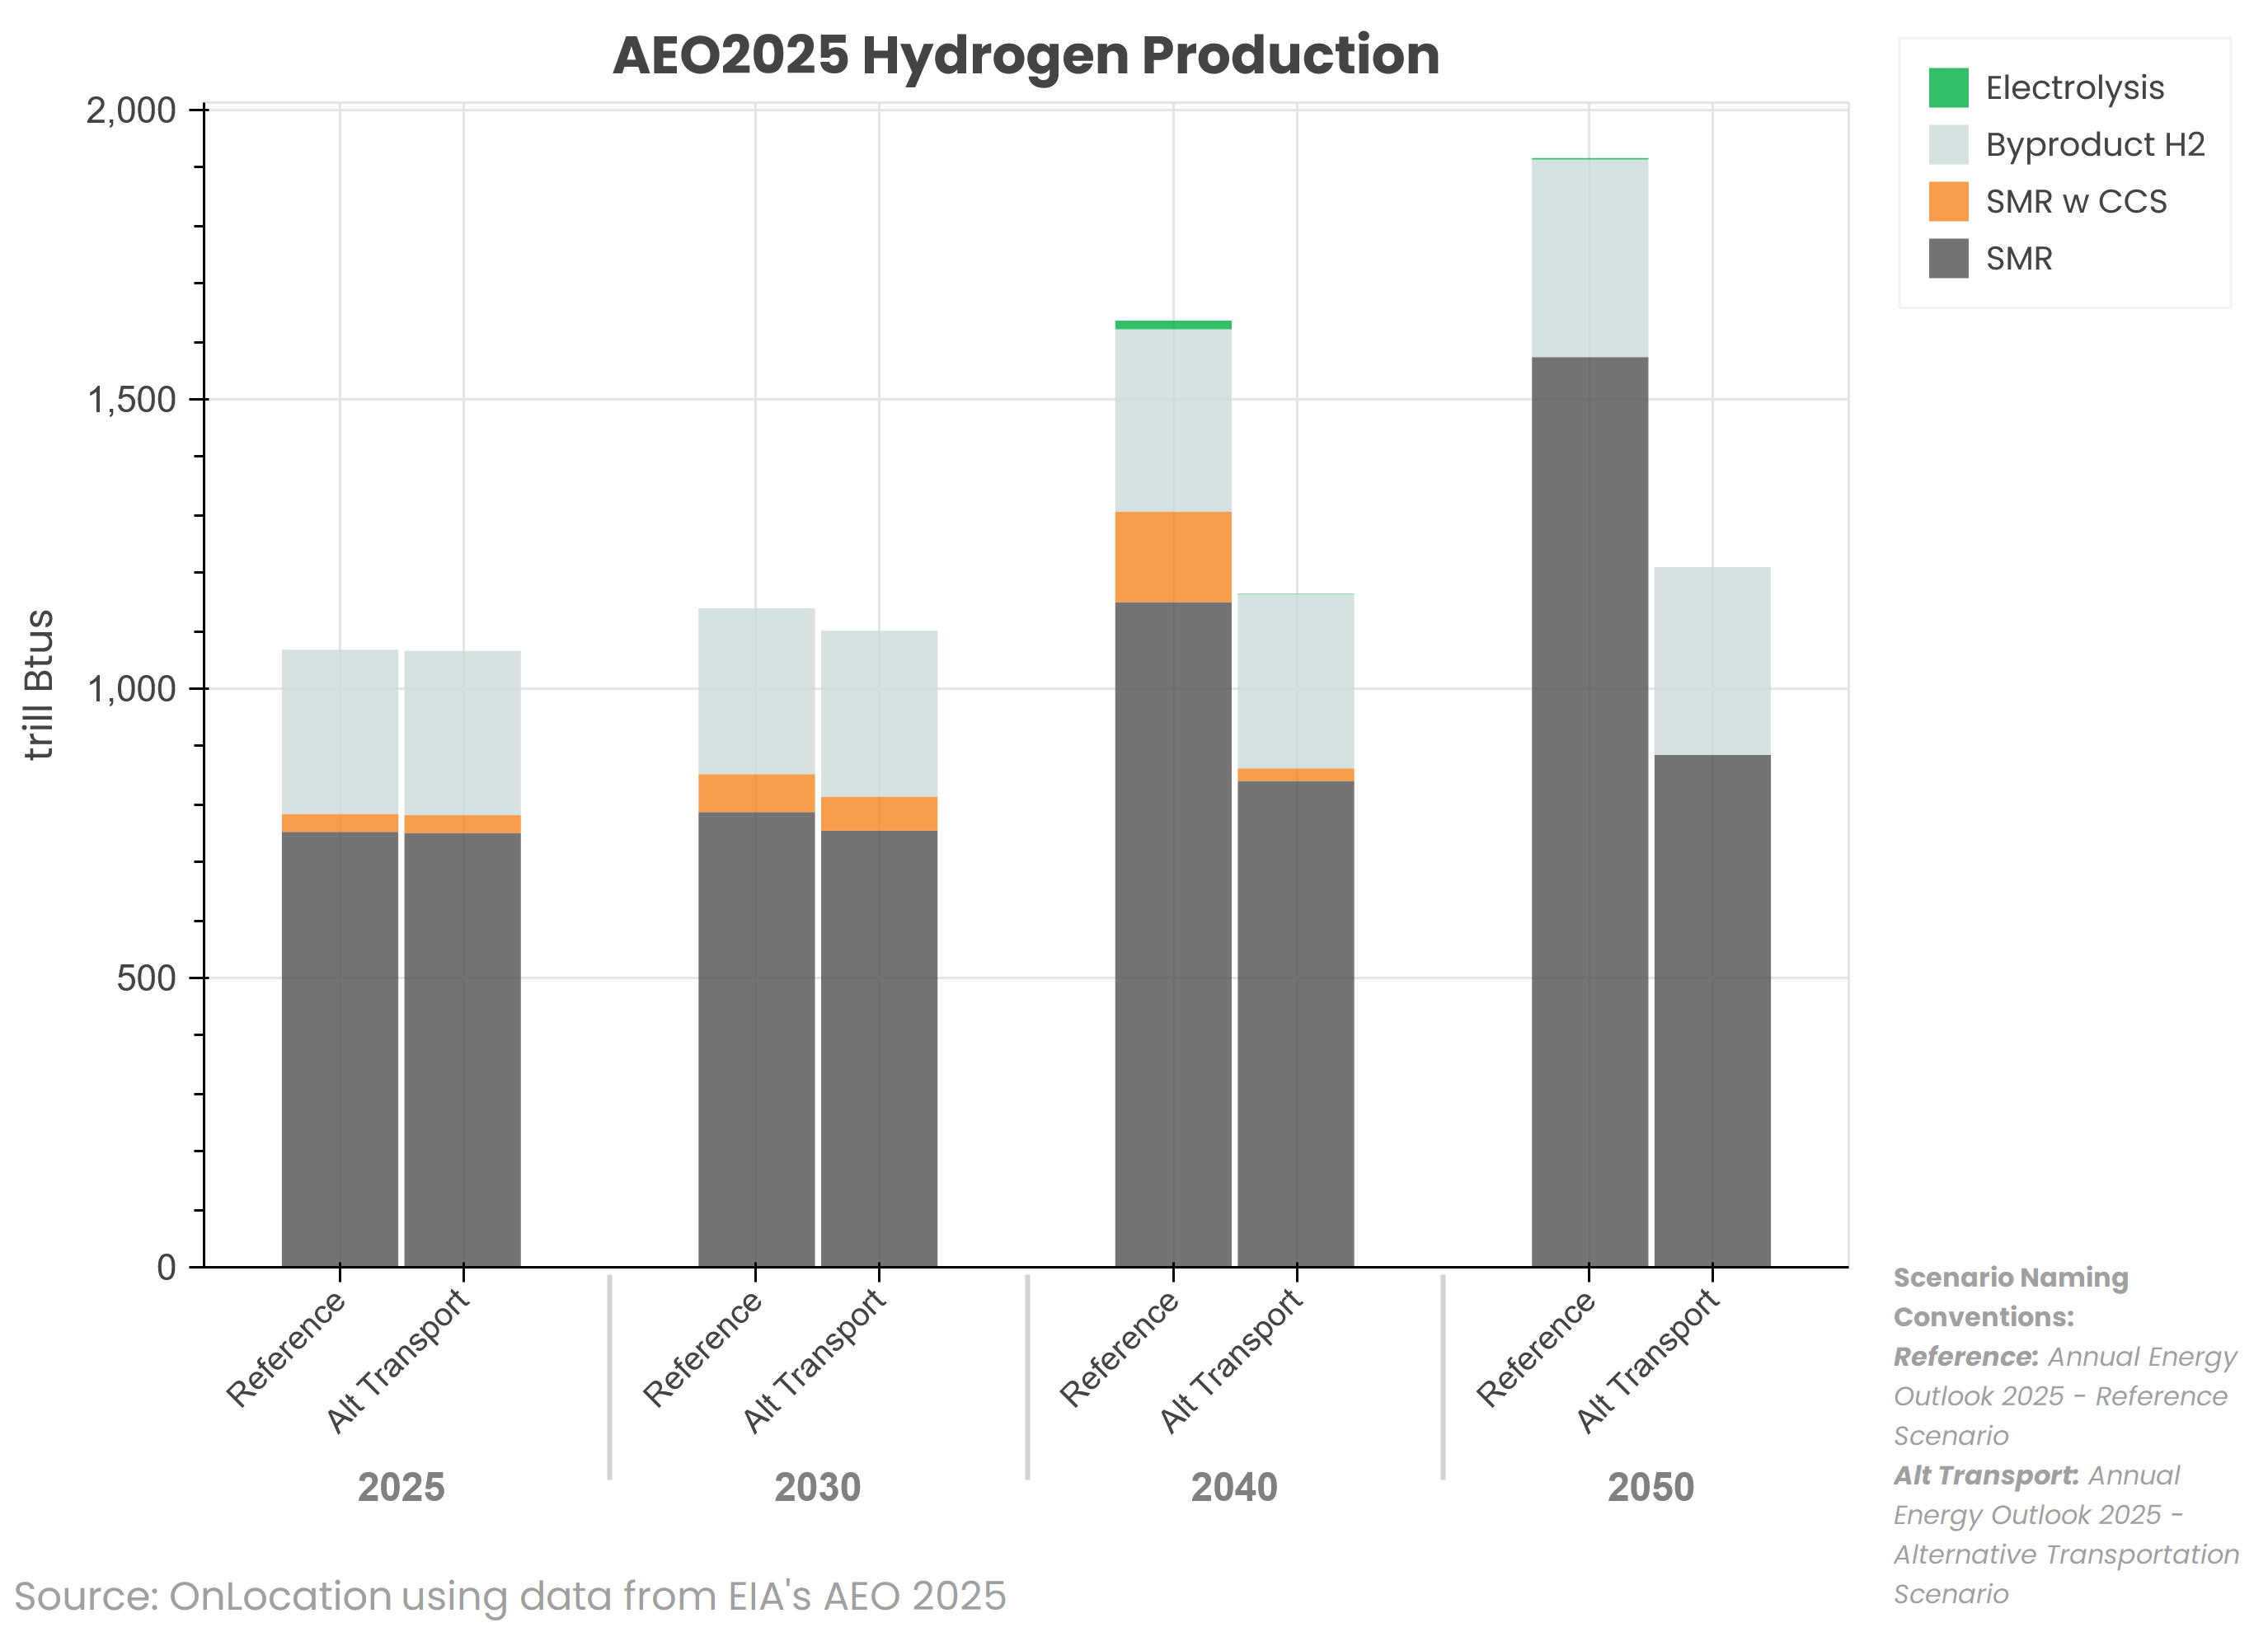
Figure 2: AEO 2025 Hydrogen Production by Technology (Reference and Alt Transport cases)
Carbon Capture, Allocation, Transportation, and Sequestration (CCATS) Module
Overview
OnLocation previously enhanced the Carbon Transport, Utilization and Storage (CTUS) submodule in the AEO 2023 to add dynamic selection of carbon capture opportunities in hydrogen (existing refining, existing ammonia and new demand), ethanol refining, natural gas processing, cement and steel in addition to the existing power plant capture and static industrial capture sources (see our blog Decarbonization: Resolving Uncertainty with Modeling + Engineering). The new EIA CCATS Module in the AEO 2025 projects the capture, transport, and storage of CO2 across the United States. Like the CTUS, the module’s CO2 pipeline network consists of point sources of capture from the aforementioned sources and sequestration of CO2 into saline formations and Enhanced Oil Recovery (EOR) sites, connected by pipes either directly or indirectly through transshipment hubs. It also utilizes the same sources for capture, transportation, and storage costs as before, but with updates. Additionally, it now includes existing CO2 capture sources and pipelines, which potentially reduce the investment costs for new sources in the region, while excluding capture from SMRs supplying hydrogen to refineries and from blast furnaces in steel. In the case of EOR, the utilization decisions from multiple sources that were previously made in individual modules now only occurs in CCATS, and as before at the individual EOR play. But it does not represent natural sources of CO2, which currently fulfill a significant portion of EOR demand for CO2 in the HSM.
CCATS passes back to the individual modules that make capture decisions, namely the Electricity Market Module, HMM, HSM, Liquid Fuels Market Module, and Industrial Demand Module, a price for CO2 at a regional level that includes the transportation and storage (T&S) cost minus the 45Q credits based on the type of sink (saline or EOR). It also provides updated capture costs for individual sectors based on deployment amounts and a technology learning rate and returns those to other modules, which then pass back regional capture quantities. CCATS then allocates the regional CO2 capture quantities based on the supply curve for individual sources in the region in the case of industrial sources and based on existing CCS facilities in the power sector. Additional CO2 is then allocated to pre-allocated nodes representing clusters of sources in every region. The complexity of the pipeline network is reduced by the time horizon under consideration, which is only 5 years at a time, as it expands the pipeline network every year from 2025 through 2050.
Key Results on Carbon Capture
Figure 3 shows the quantity of CO2 capture by source in the AEO 2025 Reference, Alt Electricity, and Alt Transport cases. While all three cases show a similar pattern wherein the capture increases between 2030 and 2040 due to the 45Q credits and then declines when the credits expire, the total capture is highest in the Reference case, followed by the Alt Transport case, and lowest in the Alt Electricity case. In the Reference case, due to the 45Q credit and updated representation of the capture opportunities across sectors, there is capture seen in ethanol and NGP in all years, hydrogen in the early and middle years, coal power plants by 2040, and Natural Gas Combined Cycle (NGCC) plants in middle and late years. Capture in the cement industry is quite small and there is none from Bioenergy with CCS (BECCS) plants in the power sector. In the Alt Electricity case, capture from coal stops after 2040 and NGCC capture declines due to the removal of EPA greenhouse gas standards that required capture or retirement for coal-fired power plants, while there is a small increase in capture from hydrogen SMRs due to the reduction in electrolyzers running on clean electricity. In the Alt Transport case, the capture is similar to the Reference case except that capture from hydrogen SMRs with CCS declines sharply due to low hydrogen demand from the transportation sector.
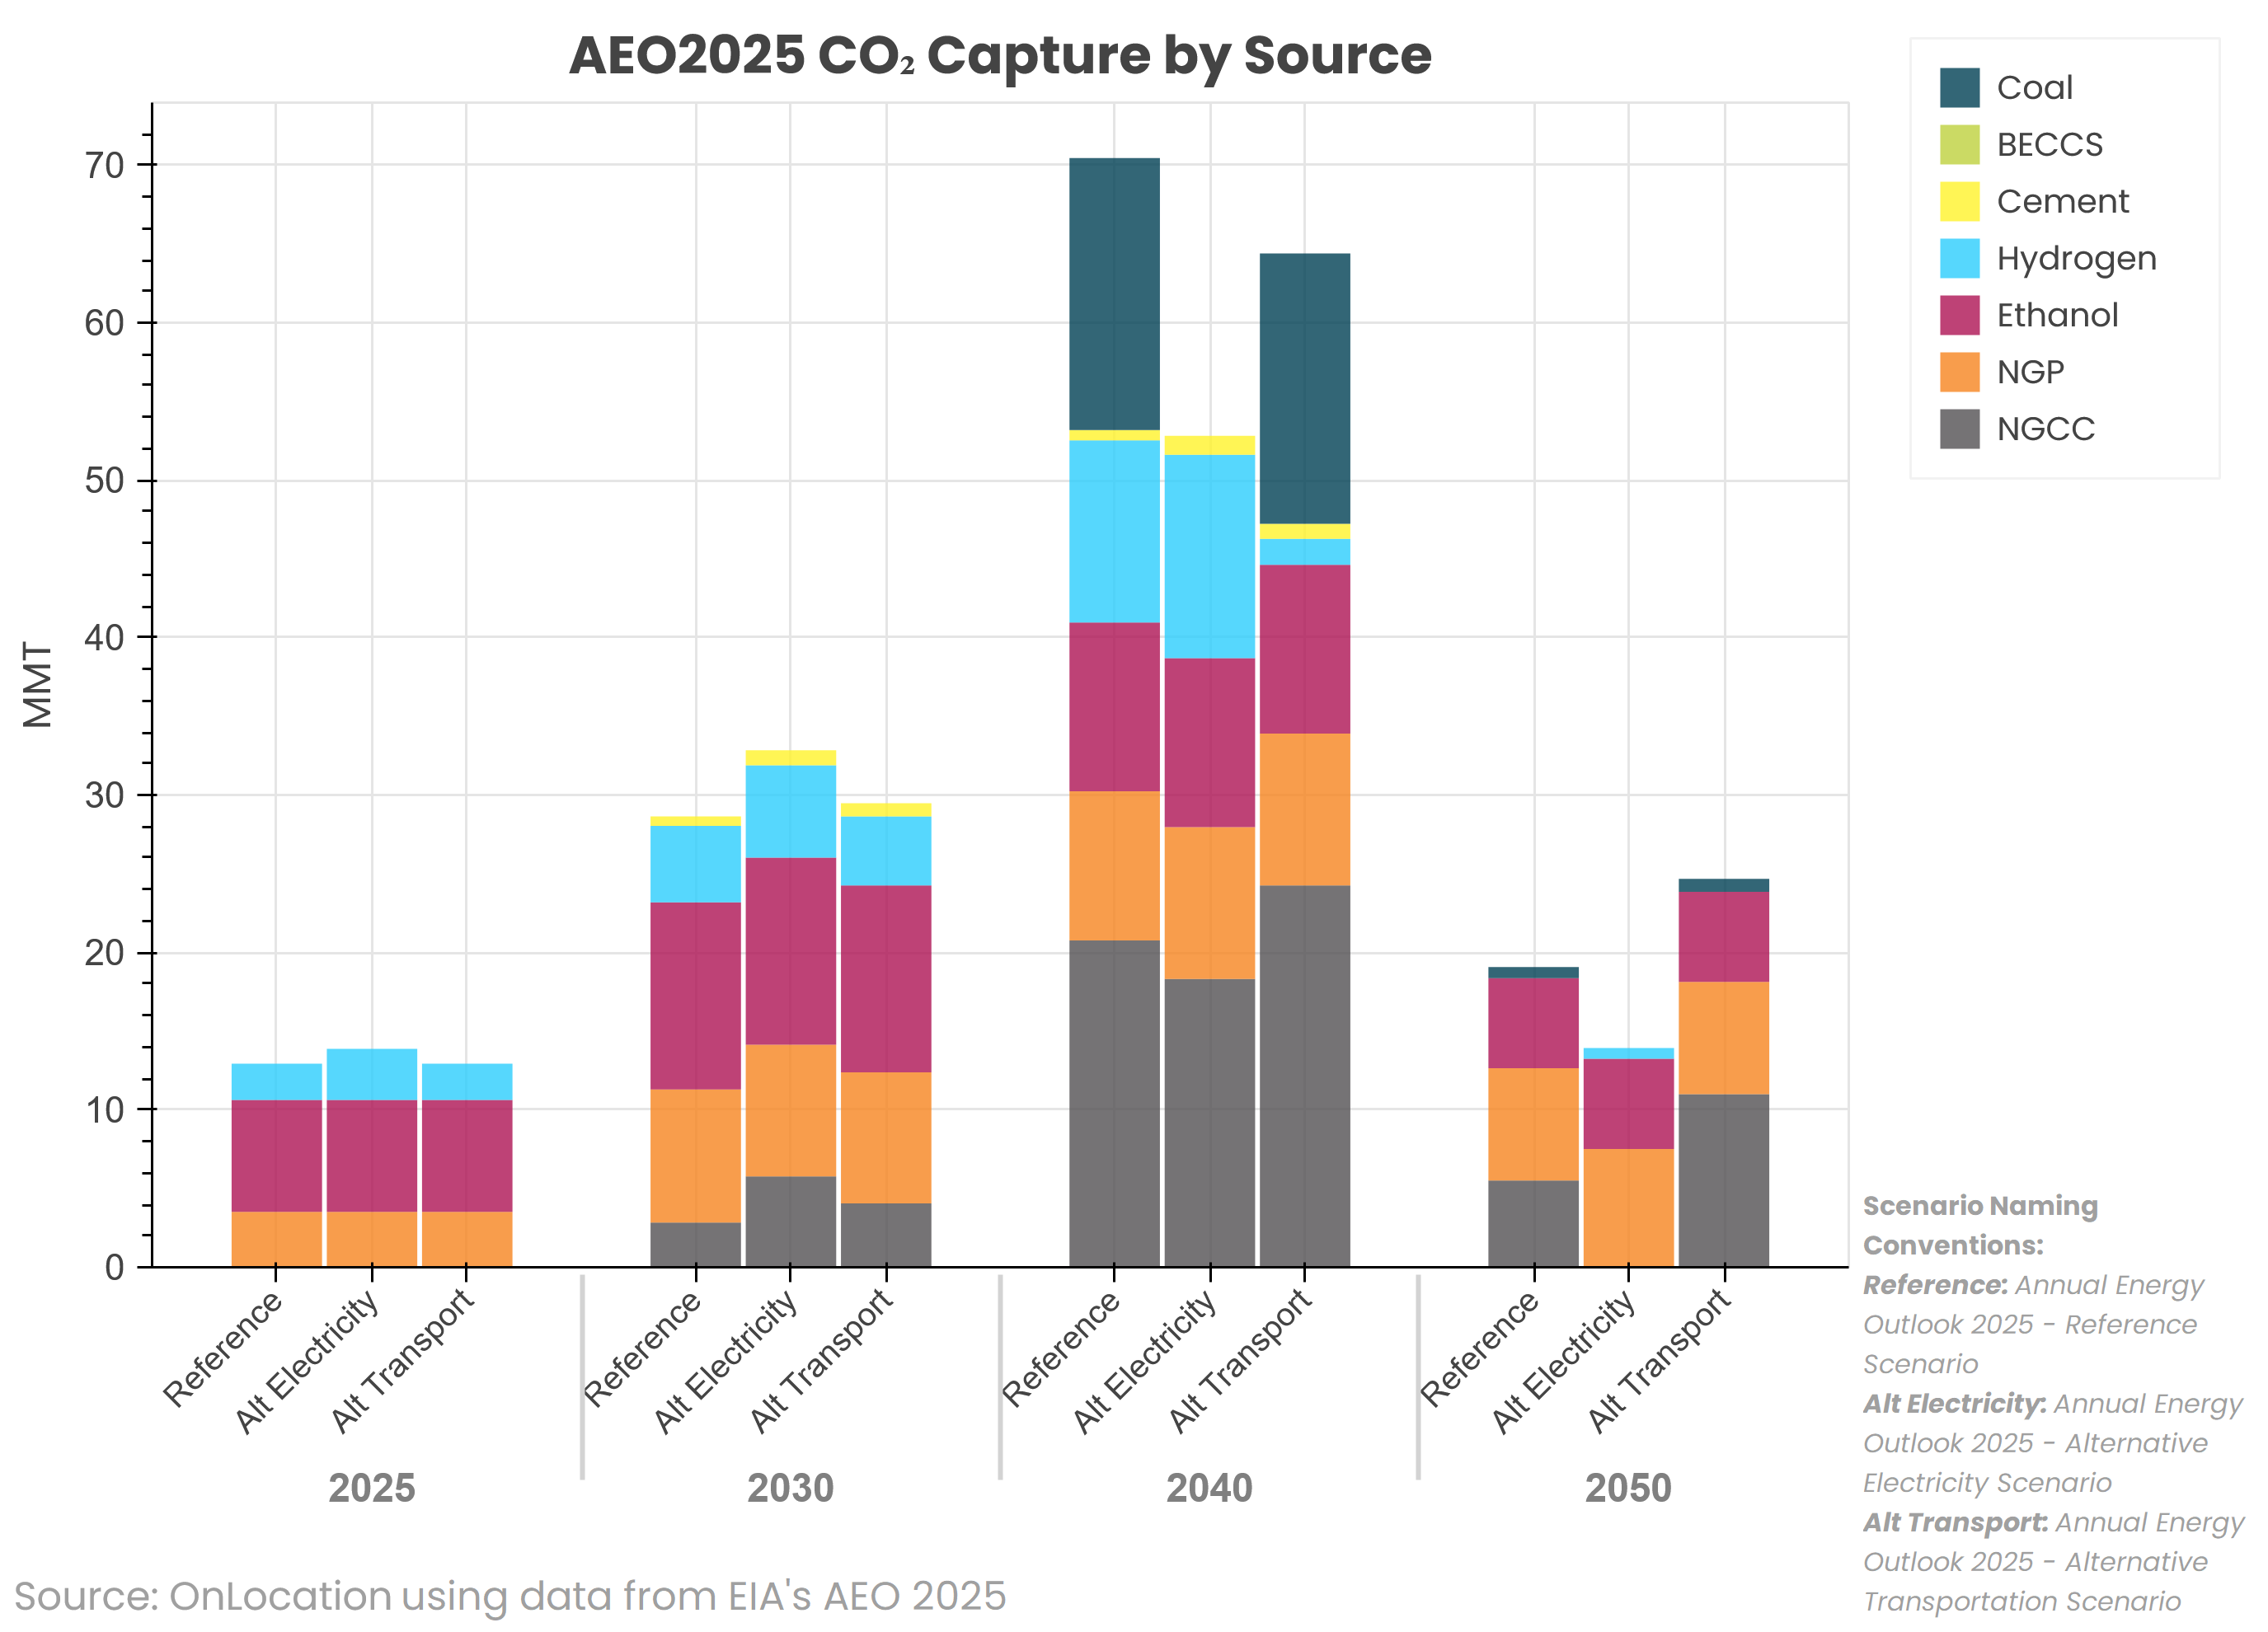
Figure 3: AEO 2025 CO2 Capture by Source and Scenario
Figure 4 shows the sinks of CO2 in the same three cases as above. It illustrates that CO2 going to EOR is fairly steady over time in the three cases, since the oil price supports paying for CO2 in addition to getting the 45Q credit, although it is slightly lower in the Alt Electricity case and higher in the Alt Transport case. As total CO2 capture declines, the CO2 sequestered in saline formations also declines in these cases.
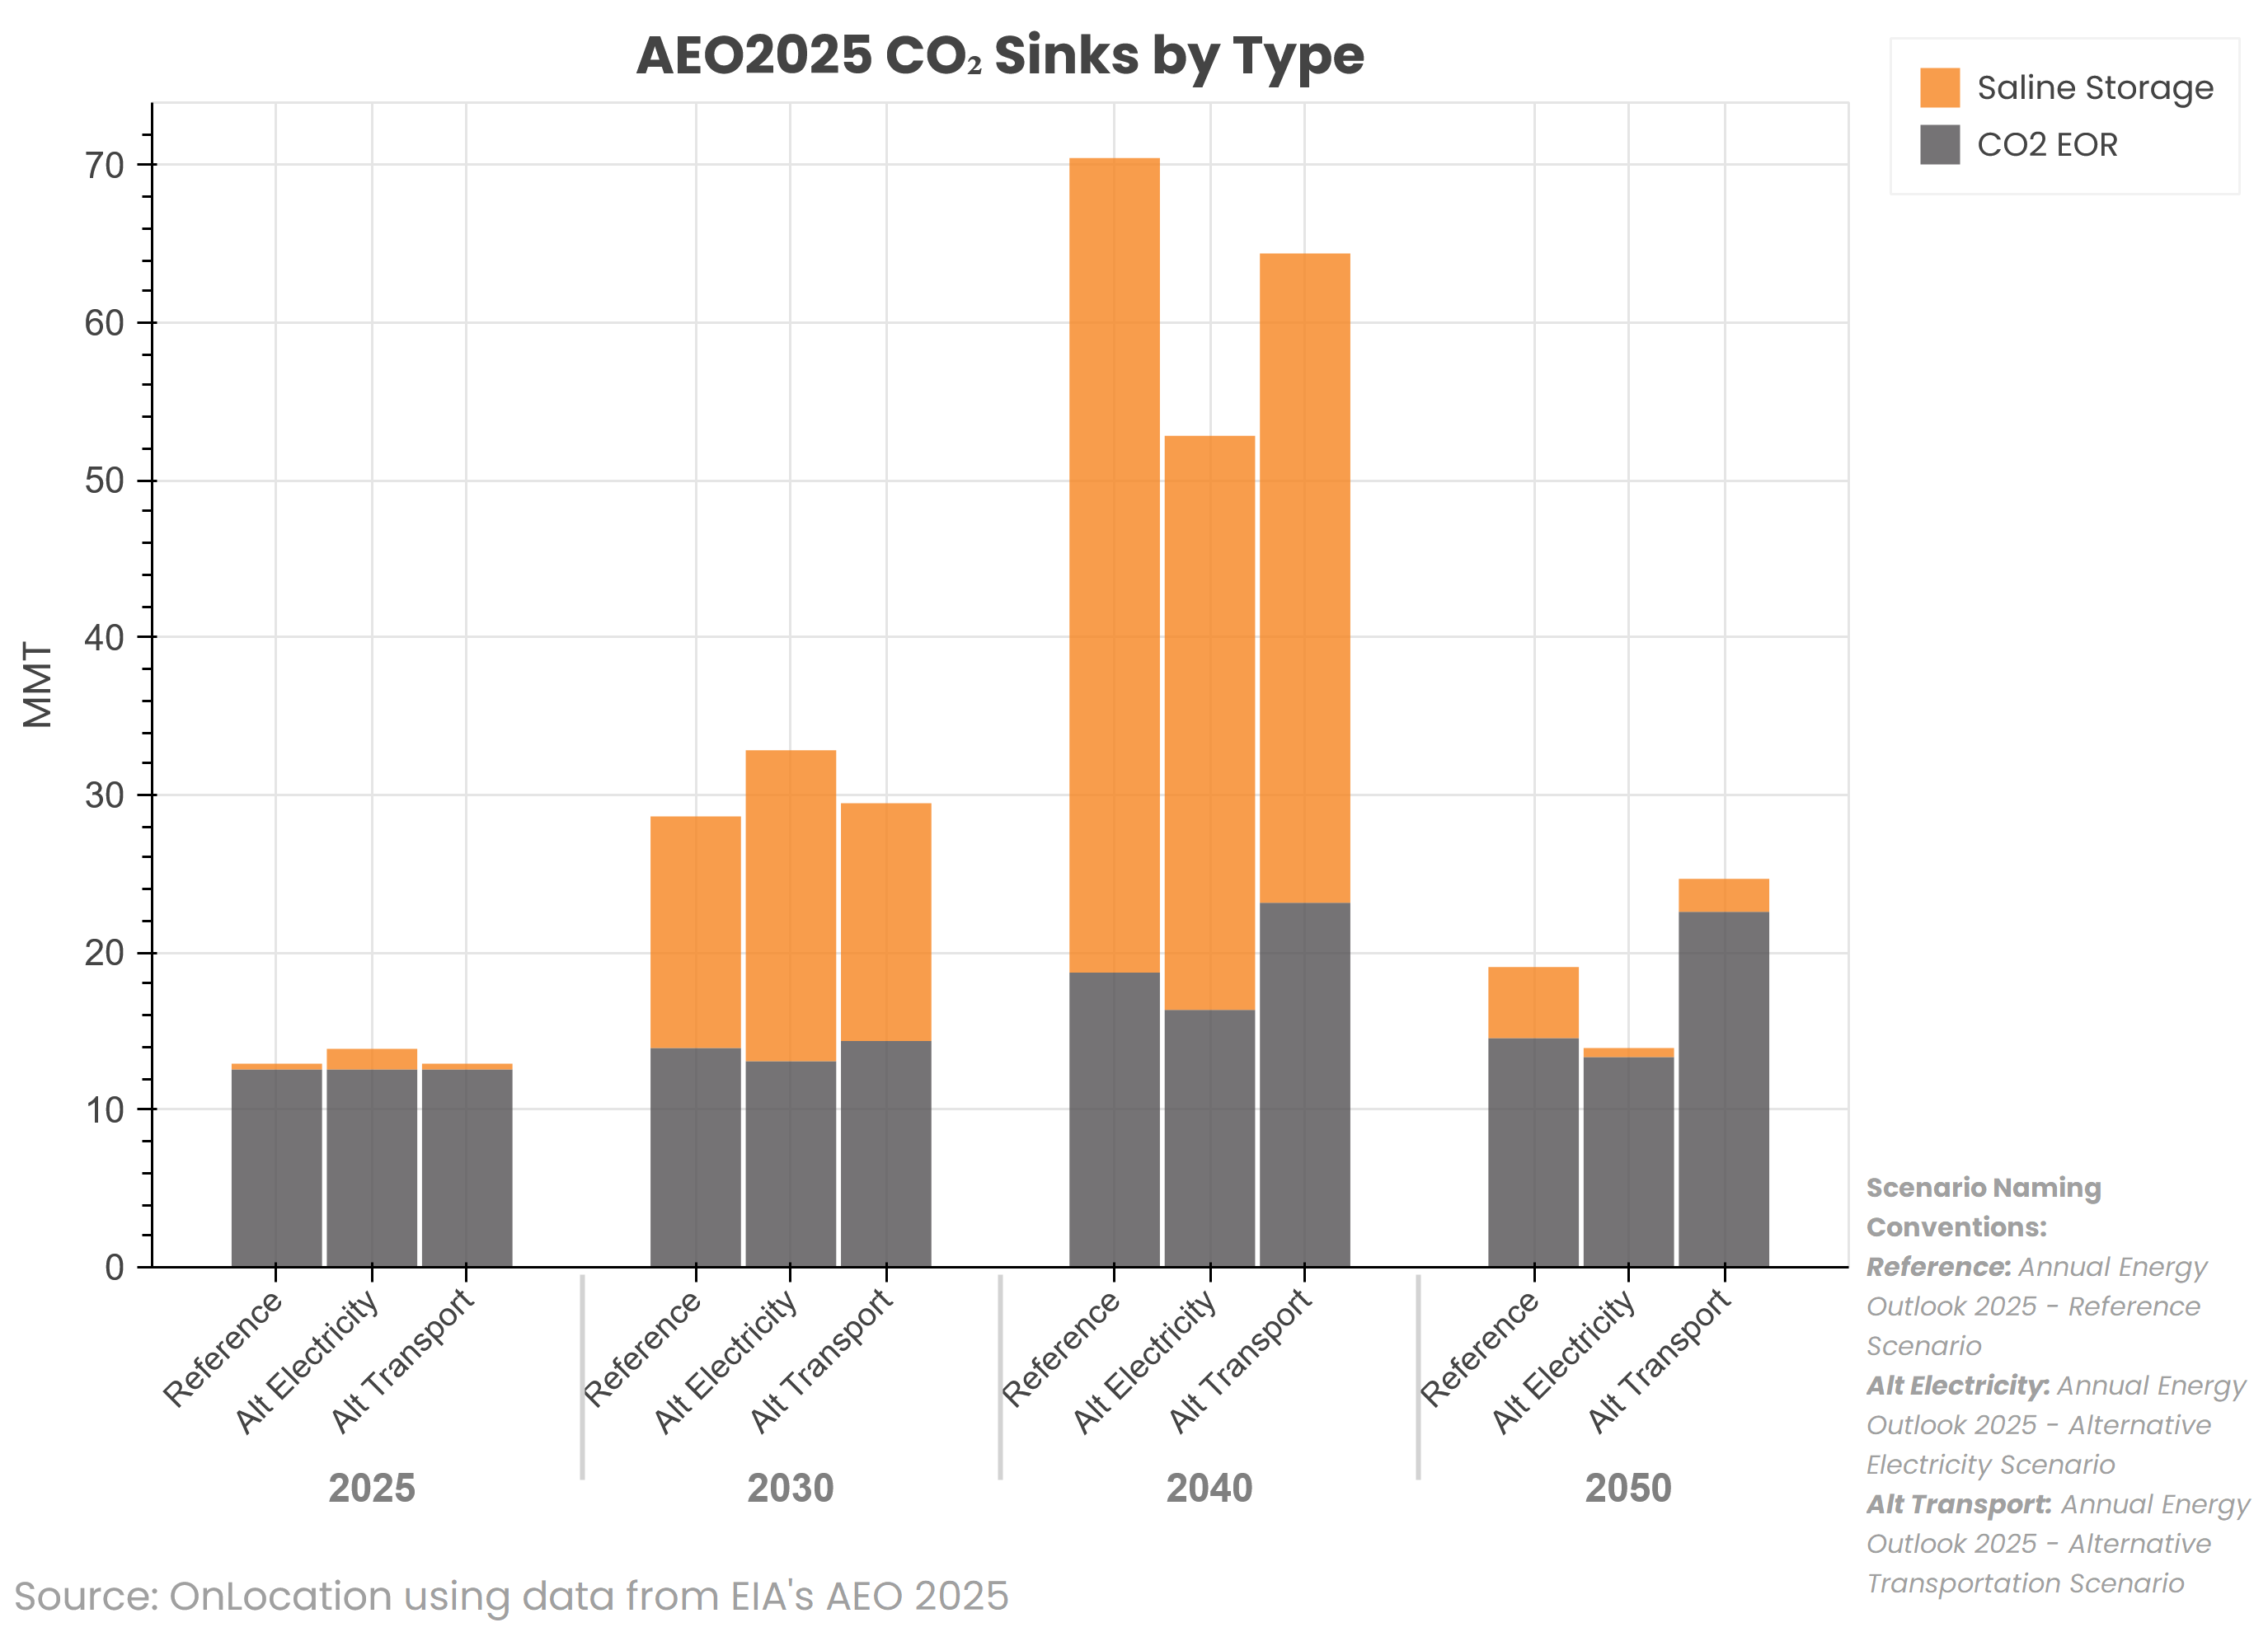
Figure 4: AEO 2025 CO2 Sequestration by Sink and Scenario
Changes in the Industrial Demand Module (IDM)
In AEO 2025, the IDM has been revised to update the input data used, integrate with the new modules discussed earlier, and update its reporting methodology. This article will only focus on these changes to the model, since the rest of the model has not changed except for updated inputs. While the latest published State Energy Data System (SEDS) year (2022 in this outlook) is used to determine census division shares, the base year data is still benchmarked to the 2018 Manufacturing Energy Consumption Survey (MECS). To clarify the role of hydrogen in the energy system, the IDM now reports hydrogen as an explicit feedstock for ammonia production and as fuel in the newly represented Direct Iron Reduction (DRI) in steel production, respectively. As mentioned in the HMM section, the implicit hydrogen production through natural gas used in SMRs is now modeled explicitly in the HMM, except for the byproduct hydrogen production that is sent from the IDM to the HMM for reporting purposes. To better represent trends in electrification in the industrial sector, electric boilers are now assumed to replace 20% of natural gas boilers and 40% of coal boilers by 2050. Another major change highlights the role of CCS in industry by adding retrofits to existing cement kilns utilizing Section 45Q credits.
Key Results in Industry
Figure 5 shows the fuel consumption in industry (excluding the refinery sector) in the AEO 2023 and AEO 2025 Reference cases. As shown, consumption reported in the AEO 2025 case is lower in all years compared to the AEO 2023 case. The decrease in natural gas consumption can be explained primarily by the changes made in the AEO 2025 to consolidate reporting of hydrogen production in the HMM as explained in earlier sections. However, the figure also shows that electricity consumption in the AEO 2025 case is higher than the AEO 2023 case due to the increased share of electric boilers. Overall energy consumption in industry is also less due to a lower industrial output in the AEO 2025 as compared to AEO 2023.
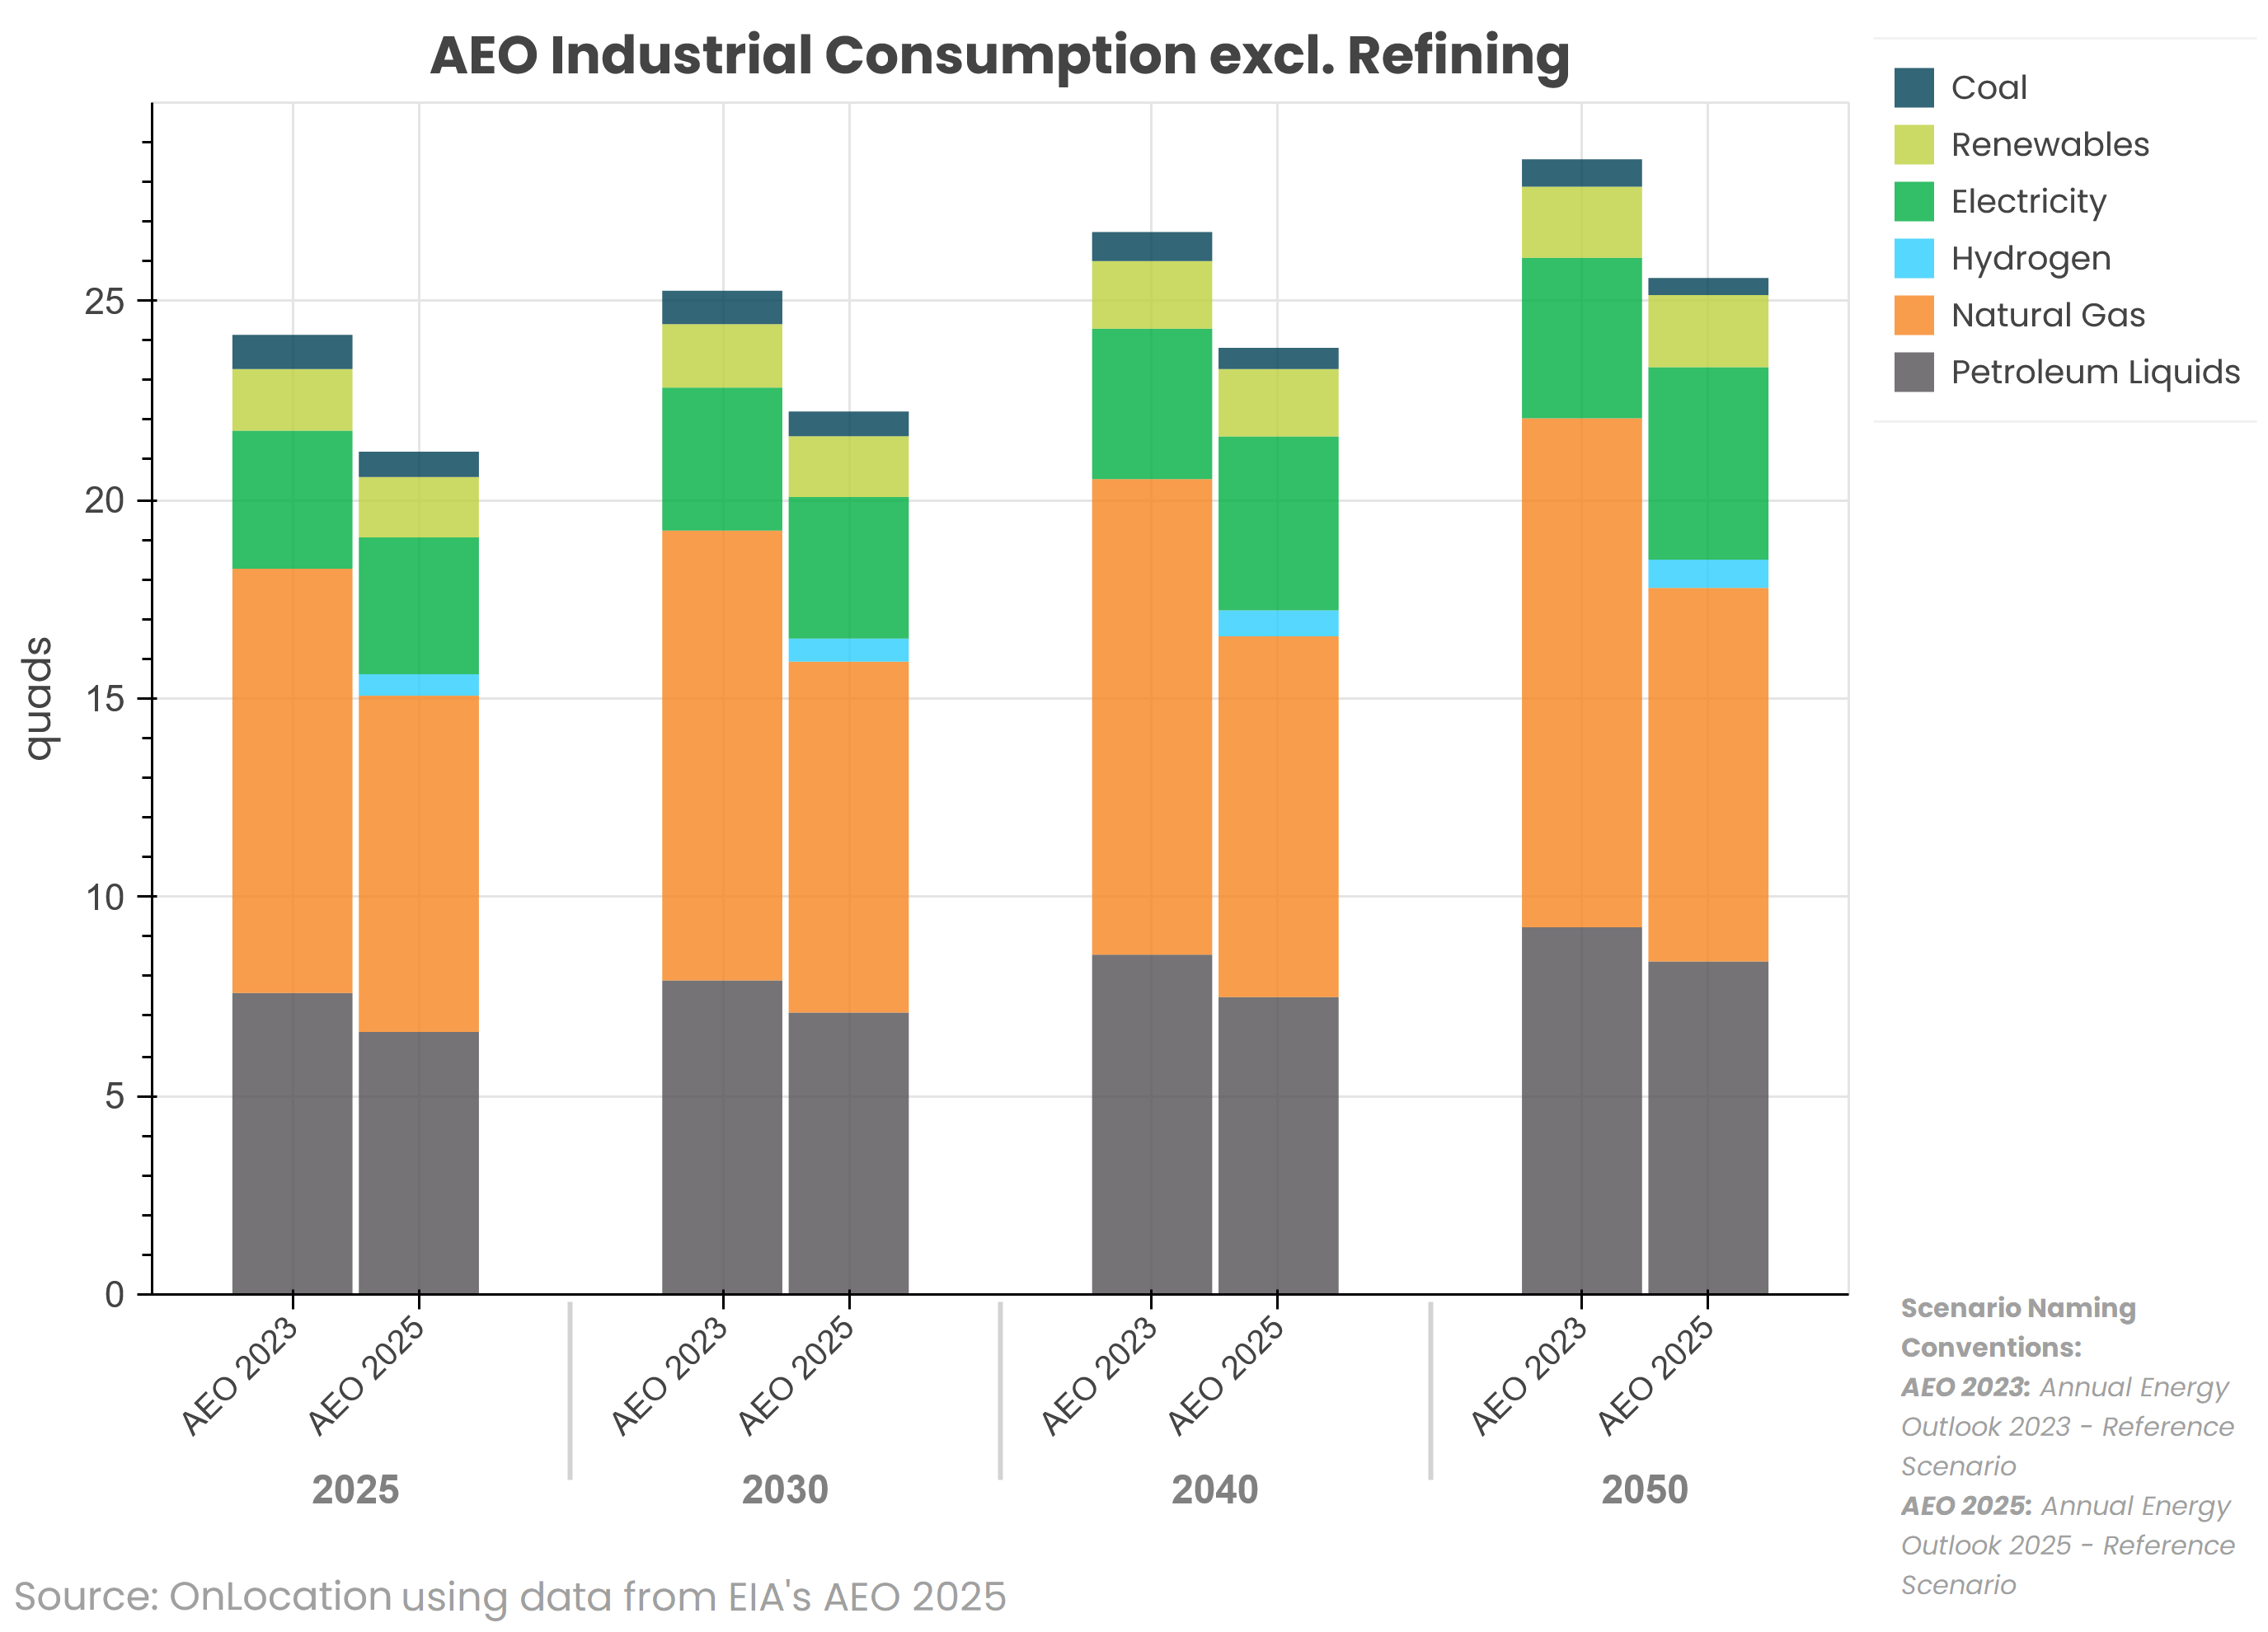
Figure 5: Industrial Energy Consumption in AEO 2025 vs AEO 2023
Summary
EIA publishes only a sample of scenarios that may be of interest to policy analysts and decisionmakers. AEO scenarios and model assumptions reflect existing energy and environmental laws, the current slate of technology options, and historical trends in consumer choice and behavior. With the rapidly changing regulatory and policy landscape, such as those included in the recently passed One Big Beautiful Bill Act (OBBBA), the AEO scenarios may quickly become outmoded. OnLocation’s experts have decades of experience using the underlying NEMS model to create and analyze “what if” scenarios with various assumptions about policies, technologies, and energy markets for a variety of clients. As described above, the AEO 2025 NEMS includes several new modules and features as well as updated data that can provide additional insights into potential changes in hydrogen markets, carbon capture technologies, and the industrial sector. The new AEO provides an excellent starting point to create customized versions of the model to explore the impact of new policies and technologies by changing the underlying assumptions and comparing the model results to the AEO “business as usual” scenarios.