
AEO 2025 Trends: Driving Transportation Policy Change
Policy Insights Gained from Administration Priorities
As part of the OnLocation weekly “AEO 2025 Trends” blog series, this article examines the U.S. Energy Information Administration’s Annual Energy Outlook (AEO) 2025 Alternative Transportation and Reference cases to gain insights into expected policy changes that will affect the future demand for internal combustion engine and alternative fuel vehicles. The AEO 2025 projections rely on the National Energy Modeling System (NEMS), a U.S. energy-economic model that is an industry standard as well as OnLocation’s primary integrated modeling tool for addressing the analytical needs of our clients.
The AEO 2025 Reference case projects the future energy system assuming U.S. laws and regulations in effect as of December 2024 remain unchanged through 2050, while the AEO 2025 Alternative Transportation side case assumes several recent regulations and policies are no longer in place, including updates to the National Highway Traffic Safety Administration’s (NHTSA) Corporate Average Fuel Economy (CAFE) Standards, the U.S. Environmental Protection Agency (EPA) Multi-Pollutant Emissions Standards and Control of Air Pollution from New Motor Vehicles as well as Advanced Clean Truck rule. In addition, the eligibility for Inflation Reduction Act (IRA) Section 30D tax credit for new clean light-duty vehicles is lower than the eligibility assumed in the Reference case. Lastly, charging infrastructure expansion and electric vehicle model availability are determined endogenously, driven by the growth in electric vehicle sales over time, rather than relying on public and private sector plans that likely depend on IRA fundings and grants or vehicle manufacturers’ announcements as of 2024, as assumed in the Reference case.
The following graph compares transportation delivered energy demand by fuel type from highway vehicles, aviation, rail, and water transport across two AEO scenarios—Reference (Ref) and Alternative Transportation (Tran Alt)—from 2025 to 2050. Transportation energy demand decreases more rapidly over time in the AEO Reference case relative to the Alternative Transportation case due to greater adoption of higher-efficiency electric and fuel cell vehicles replacing conventional vehicles. This accelerated shift in vehicle types leads to higher electricity and hydrogen consumption in the Reference scenario, while motor gasoline and diesel consumption decline sharply over the next two decades. Higher electrification and alternative fuels in the Reference scenario indicate the prominent role of EPA Greenhouse Gas (GHG) and NHTSA CAFE standards, state policies, and broader qualification under IRA provisions, which are not included in the Alternative Transportation scenario.
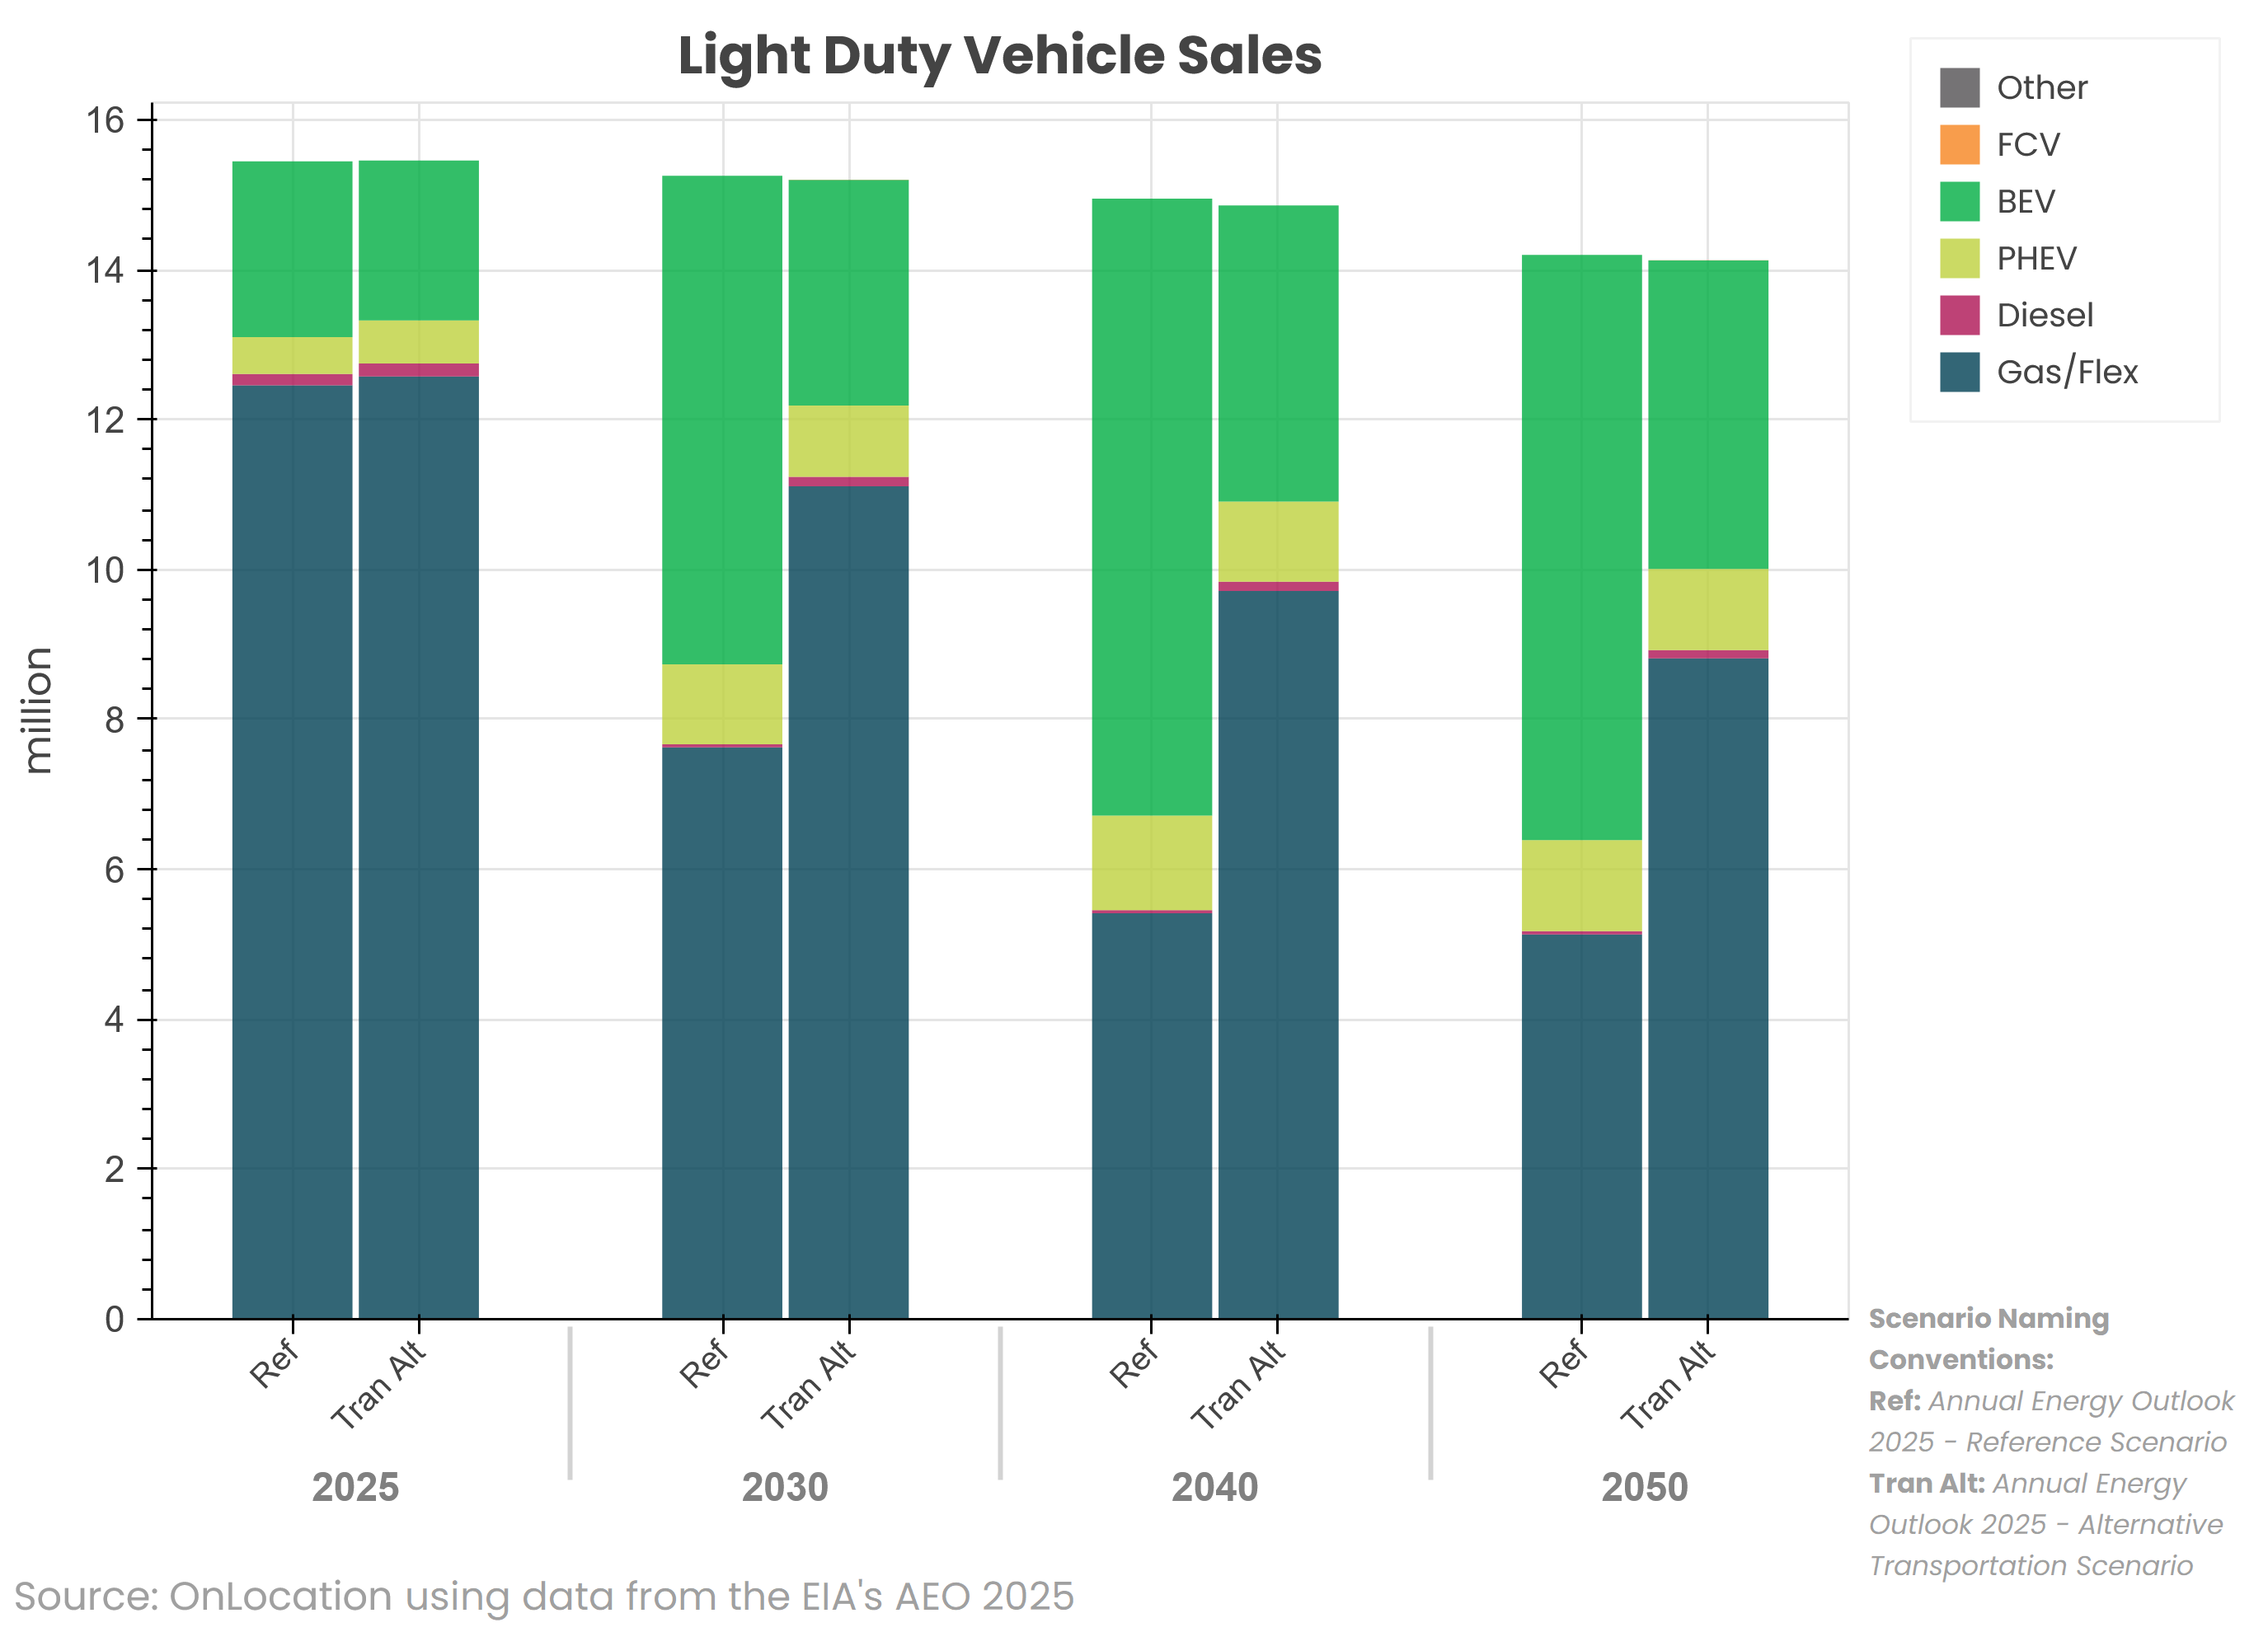
To illustrate the underlying drivers of the shifting energy mix in the two scenarios and demonstrate how changes in vehicle adoption directly impact long-term energy consumption patterns in the transportation sector, the light-duty vehicle and freight truck sales in AEO Reference and Alternative Transportation cases are presented in the charts below.
Total light-duty vehicle sales decline over time in both cases due to slower growth in macroeconomic indicators through 2050. The sales mix include gas/flex (both in conventional and hybrid configurations), plug-in hybrid vehicles (PHEV), and battery electric vehicles (BEV). In the AEO Reference case, there is a noticeable shift toward BEVs and PHEVs, especially from 2030 onward mainly due to EPA GHG standard and NHTSA CAFE for light-duty vehicles in model year 2027+ and IRA tax incentives. By 2040 and 2050, BEVs make up a significantly larger portion of total vehicle sales in the Reference compared to the Alternative Transportation scenario. Gas/Flex vehicles consistently dominate sales in the Alternative case, maintaining the highest market share throughout the years in the absence of more stringent EPA GHG and NHTSA CAFE standards as well as lower eligibility for IRA 30D tax credit and modified assumptions for BEV model availability and charging infrastructure buildout. Nevertheless, even in the Alternative case, BEV market shares rise over time as battery costs and BEV prices continue to decline. This comparison of cases highlights how policy and technological transitions can have a dramatic impact on the vehicle market landscape over time.
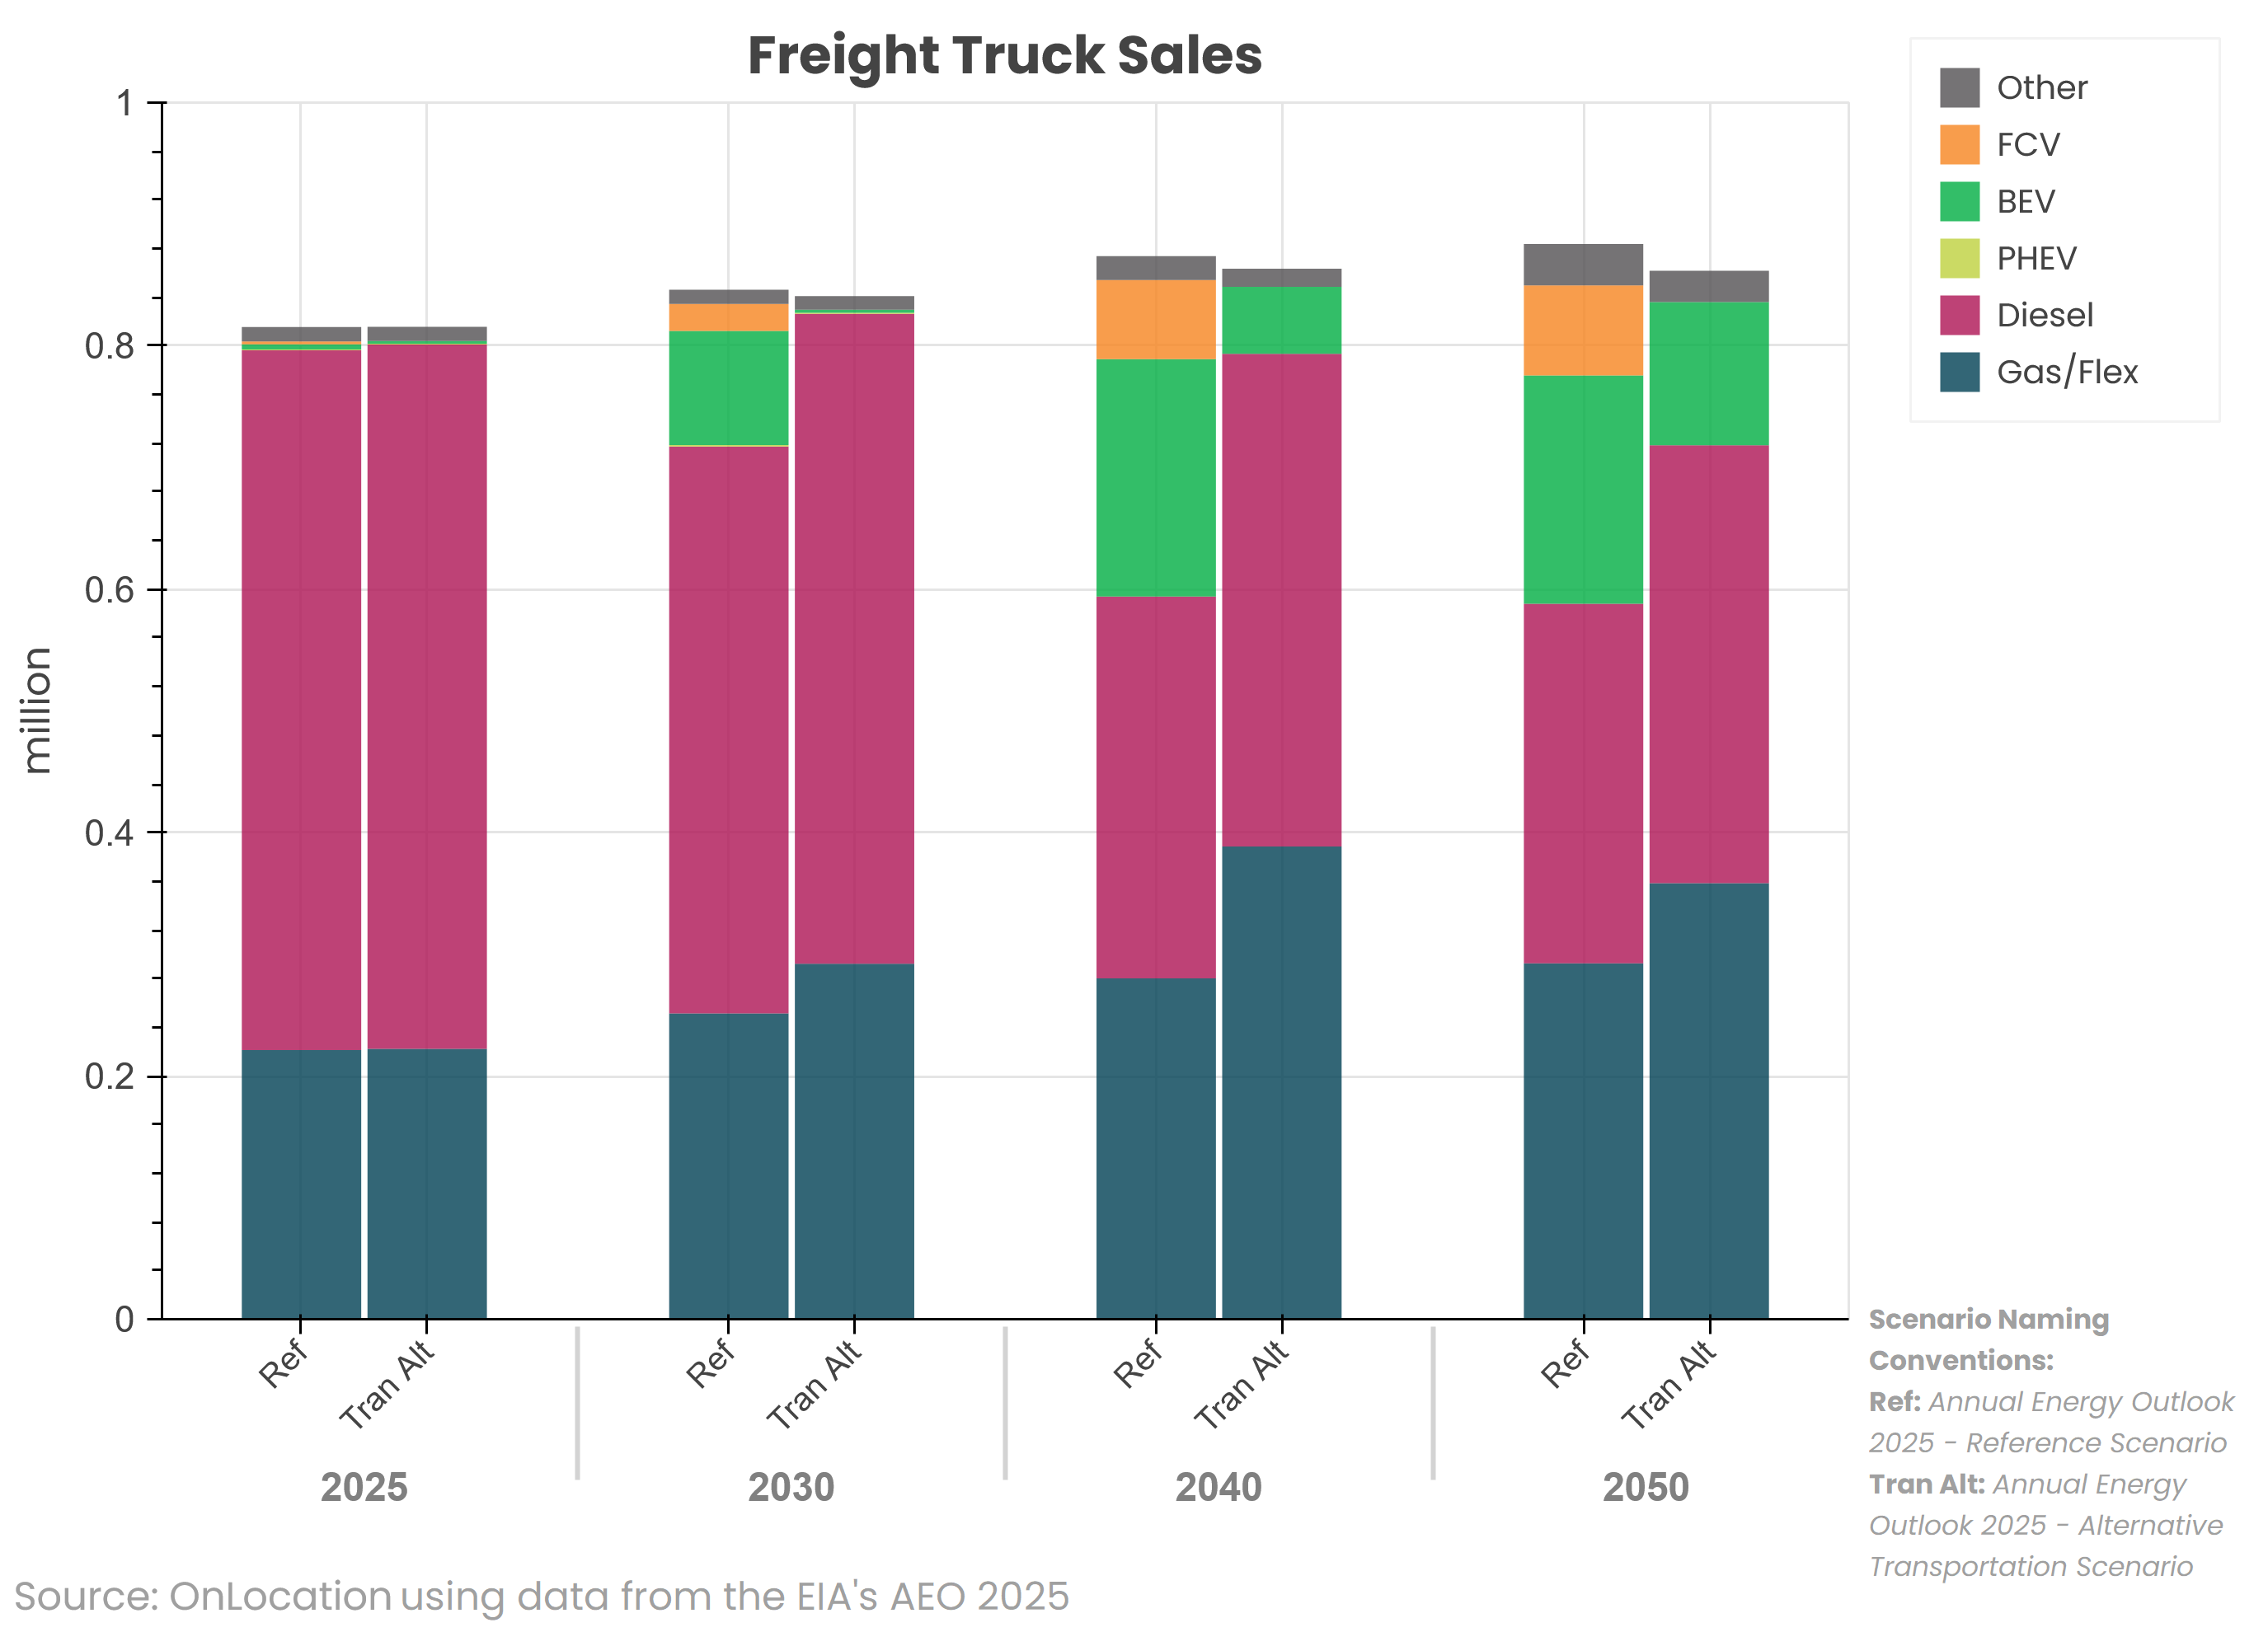
For medium- and heavy-duty vehicles, total truck sales in both scenarios include diesel, gas/flex (in both conventional and hybrid configurations), BEVs, and other trucks such as those powered by compressed natural gas and propane. Notably, hydrogen fuel cell (FCV) trucks appear only in the Reference case. The EPA phase 3 tailpipe GHG standards and low nitrogen oxide requirements for freight trucks in model year 2027+ as well as IRA tax credits and California Air Resources Board’s Advanced Clean Truck (ACT) rule (for both California and Section 177 states of the Clean Air Act) drive greater adoption of BEVs and FCVs after 2030 and reduce reliance on diesel trucks through 2050 in the Reference case. In contrast, the Alternative Transportation scenario maintains a higher proportion of diesel and gas/flex trucks, with only modest growth in BEV sales in the last decade, in the absence of the newly enacted EPA GHG standards and ACT rule.
The comparison of these two AEO 2025 scenarios provides important insights into the expected future of the transportation sector due to the evolving policy changes of the new administration. For more insights into the AEO 2025 scenario results, see the recent blogs in our AEO 2025 Trends series including Powering Future Demand and Grid Reliability and Critical Materials as well as our initial AEO 2025 overview blog posted soon after the AEO release in April.
OnLocation’s experts have decades of experience using the underlying NEMS model to create and analyze “what if” scenarios with various assumptions about policies, technologies, and energy markets. For more information about the NEMS model and integrated energy modeling, visit our website and read our NEMS blogs for answers to common questions about the model, including its capabilities and limitations, the cost of a model run, and the time it takes to perform model scenarios.