
AEO 2025 Trends: Oil and Gas Supply
As part of OnLocation’s weekly “AEO 2025 Trends” series, this blog examines the U.S. Energy Information Administration’s (EIA) Annual Energy Outlook (AEO) 2025 projections with a focus on U.S. oil and gas supply. The AEO provides an important benchmark of U.S. energy system projections to various government agencies, research institutions, and industry leaders. These projections rely on the National Energy Modeling System (NEMS), a U.S. energy-economic model that is an industry standard with detailed data and representation of energy markets, policies, and technologies in all energy supply and demand sectors.
Given the central role of domestic oil and gas production in the President’s energy dominance agenda, understanding how the EIA develops its projections in this area becomes increasingly important for evaluating future energy policy and market outcomes. This article focuses on the NEMS Hydrocarbon Supply Module (HSM), the replacement for the AEO 2023 Oil and Gas Supply Module (OGSM) and highlights key results from the AEO 2025 scenarios.
The NEMS Hydrocarbon Supply Module (HSM)
Like OGSM, the new HSM provides projections for domestic production of crude oil, natural gas, and natural gas plant liquids. It is functionally equivalent to OGSM in many ways. Four submodules in HSM perform the same functions as in OGSM, though they are rewritten and streamlined into four sources of production: Lower 48 Onshore, Lower 48 Offshore, Alaska, and Canadian Natural Gas. The submodule Lower 48 covers onshore oil and gas production for the continental United States, while Lower 48 Offshore projects offshore production, primarily in the Gulf of America. Due to their distinct geographies, there are separate modules for Alaska and Canada. New for AEO 2025 is a submodule that calculates CO2 captured at natural gas processing plants, which yields an input to the new Carbon Capture, Allocation, Transportation, and Sequestration module.
Similar to the AEO 2023, the Lower 48 Onshore, Lower 48 Offshore, and Alaska submodules use projected profitability to project drilling activities and production for each fuel type. Key changes include dis-aggregating production by state and Federal lands, adding the capability to represent penalties for methane venting and flaring, calculating secondary production volumes (such as associated gas from oil wells) separately from the primary product, updated algorithms for the Canada natural gas submodule, and, as mentioned, calculating CO2 from natural gas processing facilities. The representation of enhanced oil recovery has been simplified, and a single discounted cash flow methodology is applied across all submodules.
Key Results on Domestic Oil Production
For the AEO 2025, EIA disaggregated the decline curves for co-commodities, such as oil and gas coming from the same well and added geology-specific cost equations. They also indicated that they reviewed previous analysis of select geographic regions, which resulted in less optimistic drilling assumptions.1 Furthermore, the disaggregated representation of Federal and non-Federal lands allows an updated representation of royalty rates,2 and lower oil prices, as shown in Figure 1, reduce cash flows and thus the profitability of marginal wells. This combination of factors leads to lower production in the AEO 2025 Reference case, especially in the latter years of the projection relative to the AEO 2023 Reference case. Figure 2 shows a comparison of domestic production from the Reference case of the AEO 2023 and AEO 2025. AEO 2025 shows crude and lease condensate reaching 14.0 million barrels per day (mmb/d) in 2029, with a slow decline over the projection period to 11.3 mmb/d in 2050. By comparison, the AEO 2023 peaks at 13.3 mmb/d in 2033, with domestic production remaining relatively flat at 13.2 mmb/d in 2050.
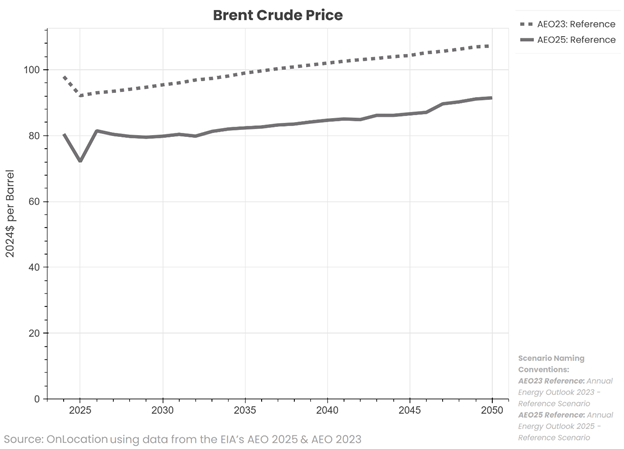
Figure 1. Brent crude prices
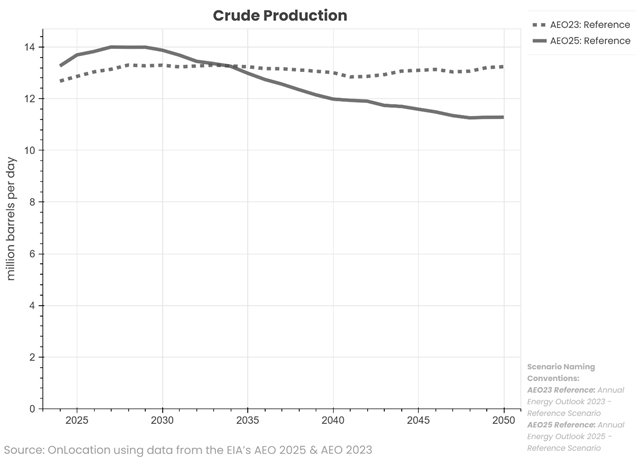
Figure 2. Domestic Crude Production
Low and high oil price scenarios
EIA’s release includes the AEO 2025 Reference case, which projects what the energy system could look like if U.S. laws and regulations in effect as of December 2024 remain the same through 2050. In addition to the Reference case, there are several sensitivity cases including Low and High Oil Price cases in response to future uncertainty about oil and gas markets. Figure 3 compares projected crude production in the AEO 2025 Reference, Low, and High Oil Price scenarios as well as the AEO 2023 Reference case. Changes in the world oil price impact the drilling profitability for the U.S. oil and natural gas producers. In the Low Oil Price case, production is 3.8 million barrels per day (or 34%) lower in 2050 than in the Reference case, while in the High Oil Price case, higher prices stimulate an additional 2.5 million barrels per day (or 22%) of production in 2050.
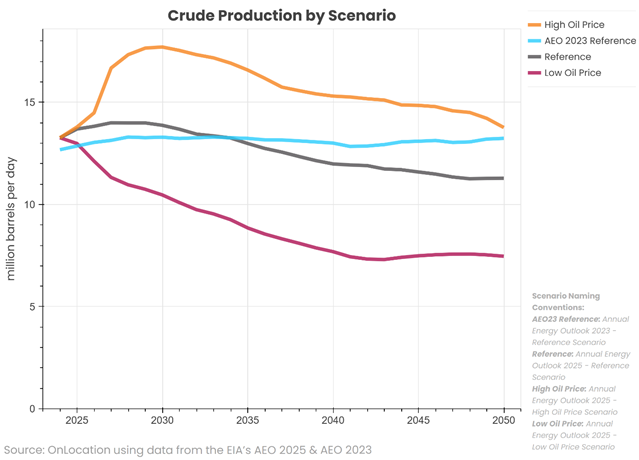
Figure 3. Domestic Crude Oil Production by Scenario
Key Results on Domestic Natural Gas Market
Natural gas production in the AEO 2025 Reference case increases over the course of the projection period, as shown in Figure 4. Responding to changes in demand, lower 48 production reaches a peak of 43.1 trillion cubic feet in 2032, corresponding to the year that environmental regulations3 require coal-fired power plants to either retrofit with carbon capture technology or retire, resulting in the retirement of approximately 60 gigawatts of coal capacity. This loss of coal generation is replaced mostly by increased natural gas generation causing demand to spike. In the later years of the projection, natural gas production levels off, ending the projection at 41.7 trillion cubic feet in 2050, very similar to that in the AEO 2023 Reference case. Since this scenario reflects laws and regulations in effect as of December 2024, EIA also included a sensitivity case, the Alternative Electricity case, that excludes the impact of the EPA greenhouse gas regulations. In this sensitivity case, the short-term rise in gas consumption and production in 2032 does not occur. OnLocation’s blog post in January, Trump’s Energy Executive Orders: Potential Impact for Production, Resource Mix, explores the Administration’s Executive Orders, such as the National Energy Emergency declaration and promoting Alaskan LNG development, and discusses how elements of NEMS could be used to quantify policies that promote domestic energy resources.
Reflecting the re-assessments of the AEO 2025 resource base, projected Henry Hub prices (Figure 5) are higher in the later years of the projection compared to the previous projection. Specifically, the 2050 terminal price is 20 percent higher than in the AEO 2023, reaching $4.80 per MMBtu in 2024$.
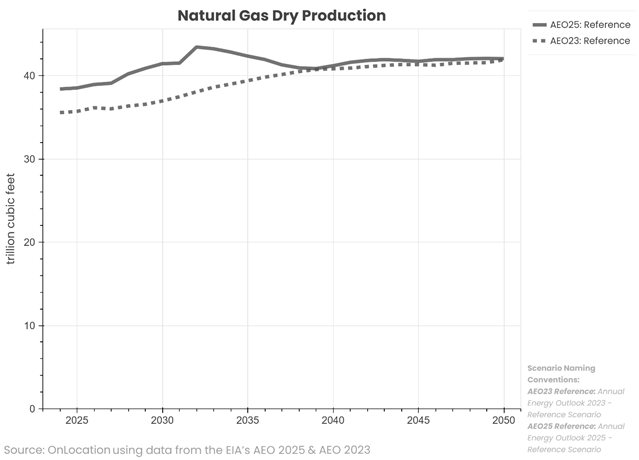
Figure 4. Domestic natural gas production
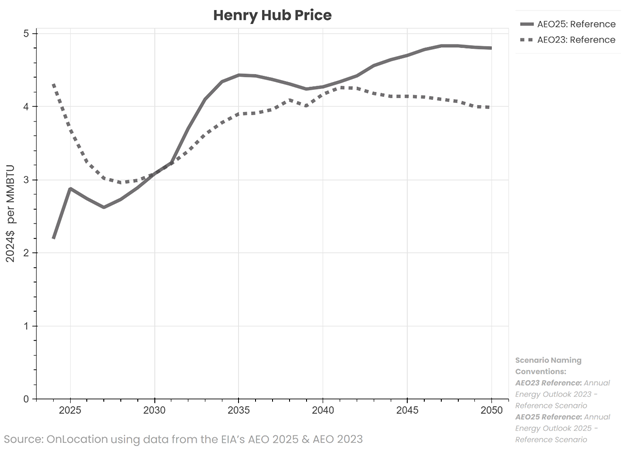
Figure 5. Domestic natural gas price between AEOs
Summary
EIA provides only a sample of scenarios that may be of interest to policy analysts. The release of the AEO each year provides OnLocation with new opportunities to use the latest AEO Reference and side cases, as well as the updated NEMS model, as the basis for exploring alternative energy policies and technologies for both government and private clients. As described above, the new oil and gas module includes several new features as well as updated data. AEO scenarios and model assumptions reflect existing energy and environmental laws, the current slate of technology options, and historical trends in consumer choice and behavior. With the rapidly changing regulatory and policy landscape, current oil and gas production scenarios may quickly become outmoded. However, the new AEO provides an excellent starting point to create customized versions of the model to explore the impact of new policies and technologies by changing the underlying assumptions and comparing the model results to the AEO “business as usual” scenarios.
For more insights into the AEO 2025 scenario results, see the recent blogs in our AEO 2025 Trends series including Powering Future Demand, Grid Reliability and Critical Materials, and Driving Transportation Policy Change, as well as our initial AEO 2025 overview blog posted soon after the AEO release in April. OnLocation’s experts have decades of experience using the underlying NEMS model to create and analyze “what if” scenarios with various assumptions about policies, technologies, and energy markets. For more information about the NEMS model and integrated energy modeling, visit our website and read our NEMS blogs for answers to common questions about the model, including its capabilities and limitations, the cost of a model run, and the time it takes to perform model scenarios.
1. EIA, “ Summary of Introduction to Hydrocarbon Supply Module (HSM) Working Group Meeting held on July 11, 2024”, July, 2024 pg. 3. Note that this summary was based on preliminary modeling and assumptions that may have changed in the published AEO.
2. EIA is currently updating the projected production of crude oil and natural gas on federal and non-federal lands.
3. U.S. Environmental Protection Agency (EPA) Clean Air Act Section 111 greenhouse gas regulations for fossil fuel-fired power plants