AEO 2025 Trends: The Outlook for Coal
This blog, covering the prospects to 2050 for U.S. coal production and consumption, is the latest in OnLocation’s AEO 2025 Trends series analyzing the results from the Energy Information Administration’s (EIA) most recent long-term energy market projections, the 2025 Annual Energy Outlook (AEO 2025). When it released AEO 2025 in April, EIA published only the results tables and not the detailed interpretative narrative that usually accompanies the tables. Our blog series aims to fill this gap.
EIA generated AEO 2025 by running the National Energy Modeling System (NEMS) for the period through 2050. The benchmark Reference Case assumes no changes to energy-relevant laws and regulations as they stood in December 2024. The Reference Case is therefore close to a “worst case” for coal because it includes the Biden Administration’s “EPA 111” regulations. These regulations impose strict carbon controls on existing and new fossil-fired power plants, including requiring many coal plants to install expensive carbon capture equipment by 2032.
The Trump Administration has announced plans to roll back the EPA 111 rules and generally implement policies that will promote fossil fuels. While none of the AEO 2025 scenarios model the full range of proposed or legislated Trump Administration policies, EIA included an Alternative Electricity Case which assumes that the EPA 111 regulations do not take effect. This scenario removes what is probably the most burdensome federal regulation from the coal-fired power sector.
This article compares the Reference and Alternative Electricity Cases to get a sense of how a more favorable regulatory climate could benefit coal. The comparison indicates that the assumed elimination of the EPA 111 regulations slows but does not arrest the long-term decline of the coal industry and, most importantly, does not reverse the fading use of coal for power generation. If some stakeholders hope to stabilize or even enhance coal’s role in the nation’s energy economy, AEO 2025 indicates that more steps than simply eliminating certain regulations will be needed.
The Big Picture
Coal occupies an unusual place in energy market discourse and policy. From one perspective it is a minor fuel which is expected to continue declining in use in both the power and industrial sectors. Figure 1 illustrates the coal percentage of total U.S. energy consumption from 1900 forward. As the graphic shows, from its peak early in the last century when it was the dominant energy source, coal has generally declined in importance. It has been steadily displaced by other fuels – first oil and natural gas, more recently renewable solar and wind power – that are less expensive to use, less cumbersome to handle, and emit fewer pollutants. Coal’s market share stabilized for about 30 years beginning in the 1980s due to coal’s predominance in power generation, but once inexpensive natural gas became available with the advent of fracking and related technologies, gas and then renewables rapidly displaced coal in the power market. In 2024 coal accounted for only eight percent of total U.S. energy consumption. By 2050 the AEO Reference Case projects this share to decline to just one percent, and even in the more favorable Alternative Electricity Case the coal share is only three percent. The distribution of projected coal consumption by sector in 2050 is shown in Table 1.

Figure 1: Coal as a % of Total US Energy Consumption, Historical and AEO Estimates
The major domestic market for coal is power generation; all other uses are minor (Table 1). But even in the power market, coal’s share is expected to decline. Coal accounted for 16 percent of power generation in 2024. In the Reference Case the coal share essentially disappears after 2032 when the EPA 111 requirements for carbon capture become effective. The AEO estimates that rather than installing this expensive equipment most coal-fired power plants will retire.
In the more favorable Alternative Electricity case, in which the EPA 111 rules are not in effect, there is no mass retirement of coal plants in 2032. However, coal plants do retire more gradually as the coal fleet ages and becomes less economic. Most importantly, no new coal plants are built. The coal generating fleet stagnates and declines although total generating capacity increases by more than 130 percent – primarily in the form of new renewable and natural gas-fired plants — to meet surging demand, especially from data centers. Even in the absence of the EPA 111 regulations, coal cannot compete with gas and renewables in the market for new generating resources. Consequently, by 2050, coal accounts for only three percent of generation (Figure 2).
Table 1. U.S. Domestic Coal Consumption, 2024 and Projections for 2050
| 2024 | Reference Case | Alternative Electricity Case | ||||
| Million Tons | Percent of Total | Million Tons | Percent of Total | Million Tons | Percent of Total | |
| Electric Power Generation | 351 | 90.5% | 1 | 5.6% | 100 | 80.5% |
| Commercial and Institutional | 1 | 0.3% | 1 | 3.5% | 1 | 0.7% |
| Coke Plants | 15 | 3.9% | 9 | 34.6% | 9 | 7.1% |
| Other Industrial | 21 | 5.4% | 14 | 56.3% | 14 | 11.7% |
| Total Domestic Consumption | 388 | 100% | 26 | 100% | 124 | 100% |
| Note: Detail may not add to total due to independent rounding. Source: EIA, AEO 2025 tables. | ||||||

Figure 2. Energy Sources Shares for Electric Generation, Alternative Electricity Case
The fundamental problem is that coal-fired power is generally more expensive than alternatives, especially natural gas and solar power. A measure often used to compare generating costs is the Levelized Cost of Electricity (LCOE). OnLocation – which is a longtime NEMS developer and runs its own customized version of NEMS, OL-NEMS – recently produced these estimates for our Energy Horizons study. Figure 3 compares the LCOE for building and operating new capacity for each of the major generating technologies, and as it illustrates, coal-fired power is the most expensive option (also see additional discussion in an earlier blog post). These LCOE estimates need to be updated for the latest regulatory and legislative changes, but they still give a sense of where coal stands in the hierarchy of generating costs. Note that Figure 3 assumes a new plant is built with carbon capture equipment, but as discussed above and illustrated in Figure 2, even removing this requirement does not reverse the decline in coal-fired power.
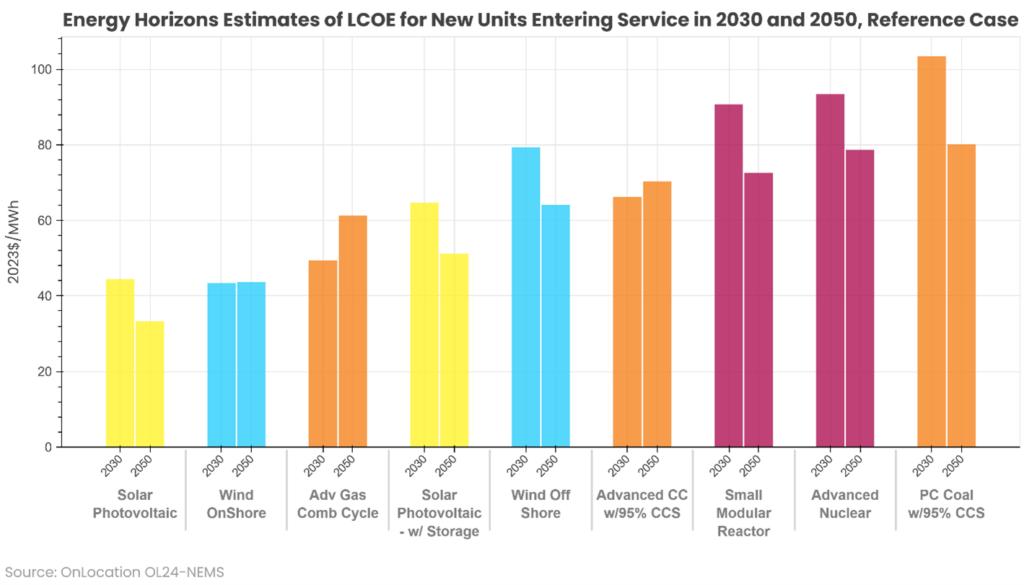
Figure 3. Energy Horizons Estimates of LCOE for New Units Entering Service in 2030 and 2050, Reference Case
Carbon and the Coal Market
If coal is projected to play a small role in future energy and electricity supply markets, there are two areas where it has outsized importance. One is carbon emissions. Burning coal without carbon capture releases about twice the carbon per unit of electricity generated than natural gas, partly because of the high carbon content of the fuel, and in part because the steam-electric technology used to produce power from coal is inefficient by modern standards. Because plants constitute a relatively small number of stationary sources that emit a significant share of total energy-sector carbon, they have been a primary target for adding carbon control measures, as evidenced by the EPA 111 regulations.
In 2024, coal-fired power accounted for 15 percent of all energy-related carbon emissions. In the Reference Case, because the EPA 111 regulations effectively force the closure of most plants by 2032, the share of emissions drops to just 2 percent. In the Alternative Electricity Case, with more surviving coal-fired power plants, the coal share of carbon emissions does not go below seven percent. While this is arguably a relatively small slice of total energy sector emissions, it is disproportionate to its share of total energy consumption. As shown in Figure 4, the fraction of emissions is about twice the coal share of energy consumption.

Figure 4. Comparison of Coal Shares of Total Energy Consumption and Energy Sector Carbon Emissions, Alternative Electricity Case
The other area where coal continues to have central importance is, of course, to the firms that produce and transport coal, and the employees and communities that the industry helps to support. To these stakeholders not only is the total amount produced important but also where it is produced.
In this part of the article, we will broaden the discussion from coal consumption to coal production and, crucially, exports. Figure 5a compares for the Reference Case the total supply with the amount of supply that is exported. As the figure illustrates, in the Reference Case production plummets after the 2032 deadline for compliance with the strict EPA 111 carbon controls, and almost all the remaining production is devoted to coal exports. Domestic consumption – essentially the difference between supply and exports – is only 39 million tons by 2040 and 26 million tons in 2050, most of which is used in facilities that convert metallurgical grade coal to coke for steel production. In contrast, exports run between 110 and 122 million tons of coal annually, accounting for the disposition of over 80 percent of U.S. supply by 2050.
Export-quality coal must have a high heat content or be suitable for manufacturing metallurgical coke. In the United States, almost all export-grade coal is produced in Appalachia. Consequently, in the Reference Case, in which the domestic demand collapses and the remaining demand is nearly all from overseas, almost all remaining production takes place in Appalachia. This is illustrated in Figure 5b, which shows how projected production in the Interior (Illinois Basin) and West (primarily Wyoming) regions sharply decline after 2032. Appalachia, the oldest U.S. coal producing region, in this scenario is essentially the only surviving coal production basin.
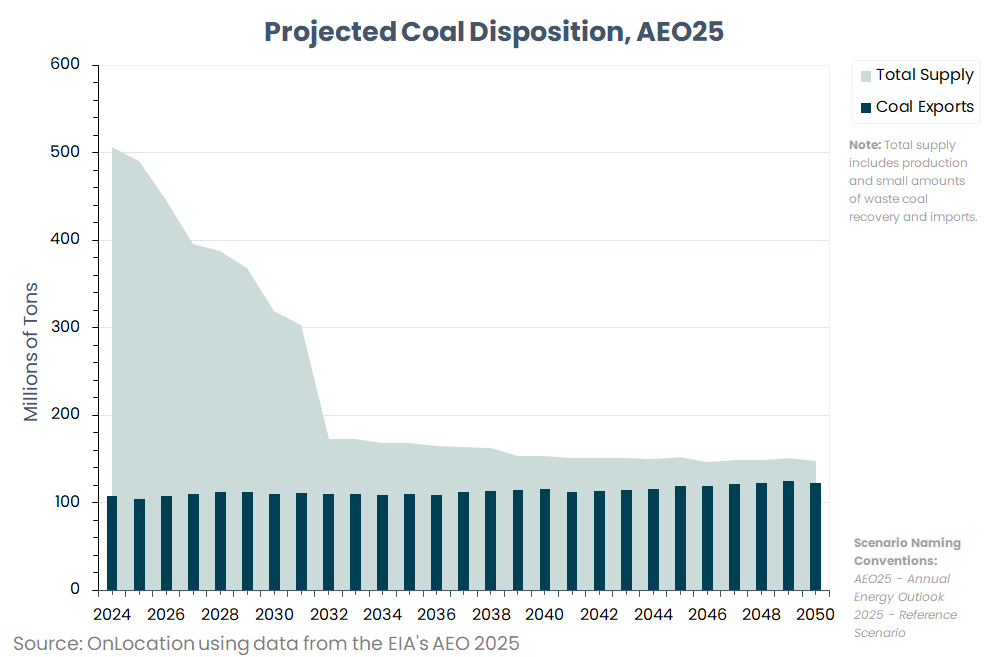
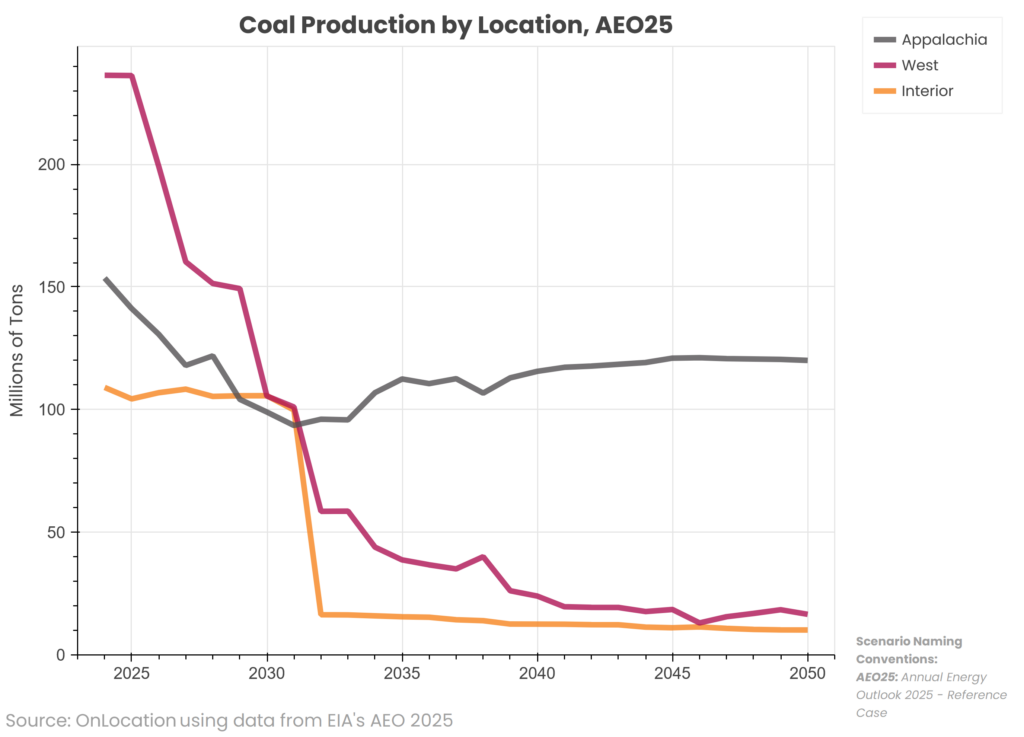
Figure 5a. Projected Coal Disposition, Reference Case
Figure 5b. Coal Production by Location, Reference Case
In the Alternative Electricity Case, in which a larger electric power market for coal continues through 2050, the markets are more evenly balanced. Figure 6a shows how production eventually stabilizes at about 250 million tons a year through 2050, of which exports account for roughly half. Power generation consumes most of the balance. In this scenario Appalachia is still the largest coal producing region (Figure 6b), but there is, compared to the Reference Case, more significant production in the Interior and West regions (respectively 47 and 74 million tons by 2050).
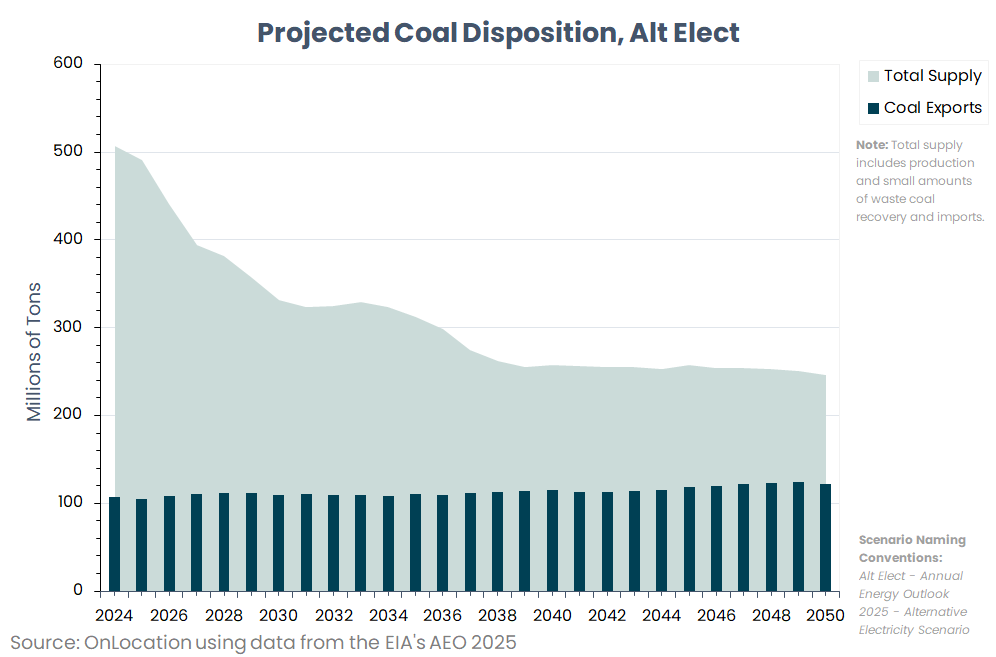

Figure 6a. Projected Coal Disposition, Alternative Electricity Case
Figure 6b. Coal Production by Location, Alternative Electricity Case
The AEO 2025 projections and our analysis will need to be updated to incorporate the full array of Trump Administration policy changes, such as the recently enacted curtailment of renewable energy credits. As noted above, OnLocation operates its own version of NEMS, and has decades of experience in the application and enhancement of NEMS for its clients. To learn how OnLocation’s modeling tools and team of energy market analysts can help stakeholders navigate an increasingly volatile and uncertain energy future, contact us.
For more insights into the AEO 2025 scenario results, see our AEO 2025 Trends series including, Growing Electricity Demand from Data Centers, Powering Future Demand, Grid Reliability and Critical Materials, Driving Transportation Policy Change, and Oil and Gas Supply, as well as our initial AEO 2025 overview blog posted soon after the AEO release in April.